

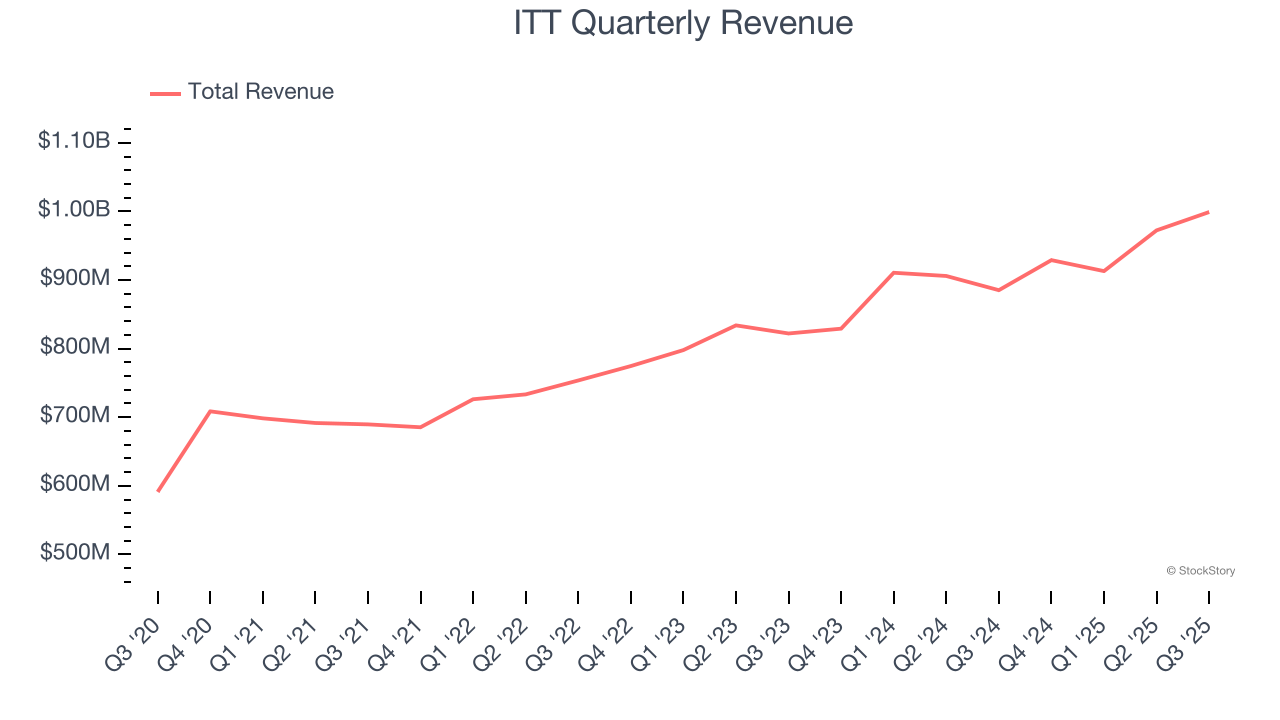
Engineered components manufacturer for critical industries ITT Inc. (NYSE: ITT) reported Q3 CY2025 results exceeding the market’s revenue expectations, with sales up 12.9% year on year to $999.1 million. Its non-GAAP profit of $1.78 per share was 6.7% above analysts’ consensus estimates.
Is now the time to buy ITT? Find out by accessing our full research report, it’s free for active Edge members.
ITT (ITT) Q3 CY2025 Highlights:
- Revenue: $999.1 million vs analyst estimates of $974.1 million (12.9% year-on-year growth, 2.6% beat)
- Adjusted EPS: $1.78 vs analyst estimates of $1.67 (6.7% beat)
- Adjusted EBITDA: $215 million vs analyst estimates of $214.4 million (21.5% margin, in line)
- Management raised its full-year Adjusted EPS guidance to $6.65 at the midpoint, a 3.1% increase
- Operating Margin: 18%, down from 23.5% in the same quarter last year
- Free Cash Flow Margin: 20.2%, up from 9.9% in the same quarter last year
- Organic Revenue rose 6.1% year on year vs analyst estimates of 3.9% growth (221.3 basis point beat)
- Market Capitalization: $13.72 billion
Company Overview
Playing a crucial role in the development of the first transatlantic television transmission in 1956, ITT (NYSE: ITT) provides motion and fluid handling equipment for various industries
Revenue Growth
Reviewing a company’s long-term sales performance reveals insights into its quality. Any business can put up a good quarter or two, but many enduring ones grow for years. Thankfully, ITT’s 8.9% annualized revenue growth over the last five years was decent. Its growth was slightly above the average industrials company and shows its offerings resonate with customers.
Long-term growth is the most important, but within industrials, a half-decade historical view may miss new industry trends or demand cycles. ITT’s annualized revenue growth of 8.7% over the last two years aligns with its five-year trend, suggesting its demand was stable. 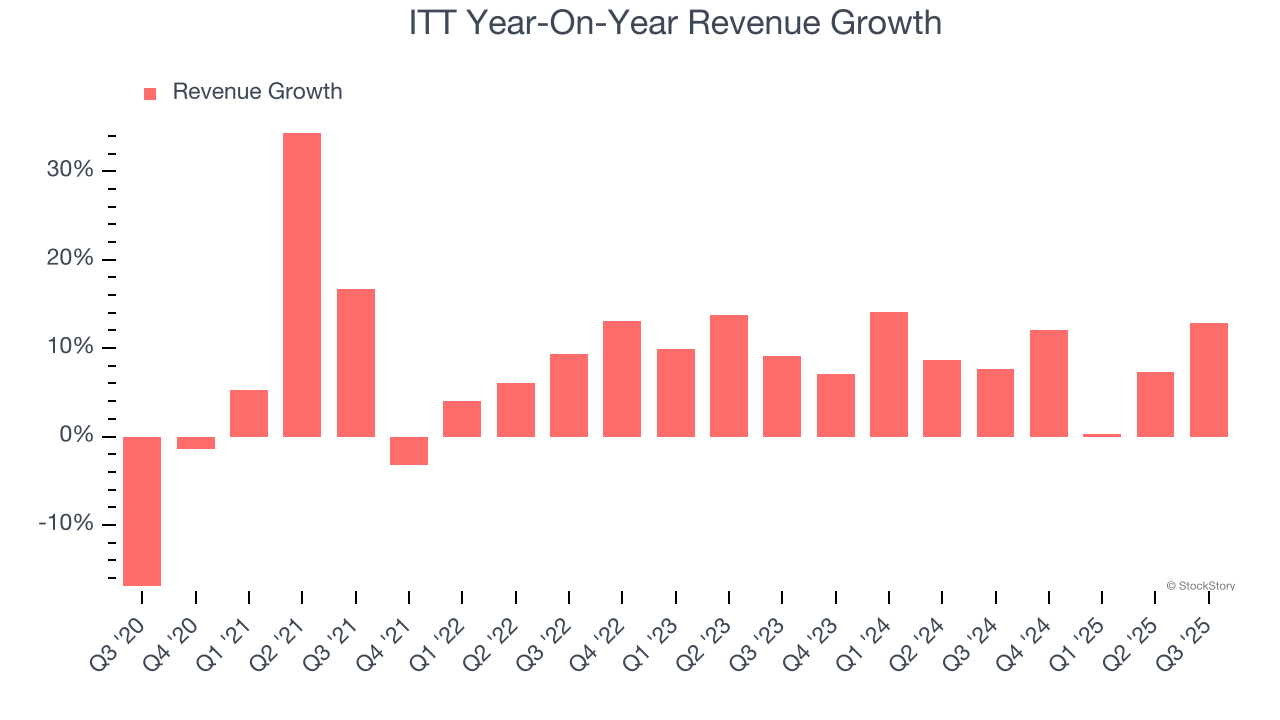
We can better understand the company’s sales dynamics by analyzing its organic revenue, which strips out one-time events like acquisitions and currency fluctuations that don’t accurately reflect its fundamentals. Over the last two years, ITT’s organic revenue averaged 5.2% year-on-year growth. Because this number is lower than its two-year revenue growth, we can see that some mixture of acquisitions and foreign exchange rates boosted its headline results. 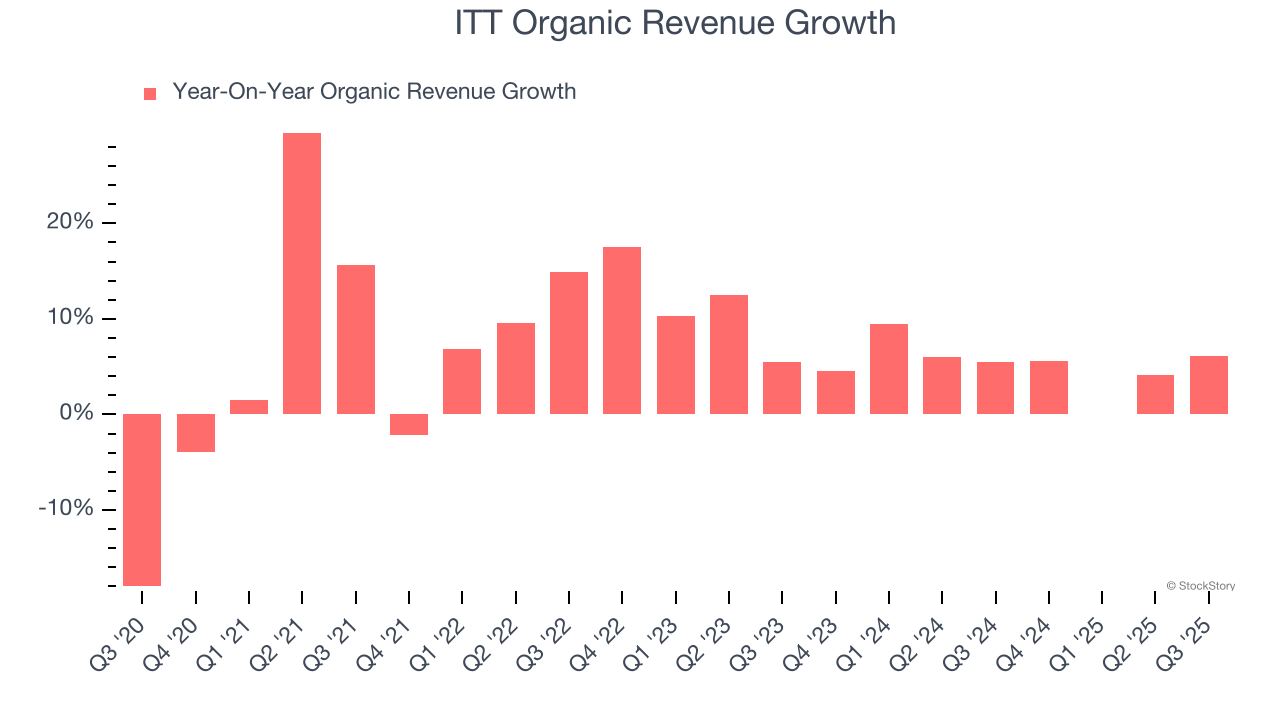
This quarter, ITT reported year-on-year revenue growth of 12.9%, and its $999.1 million of revenue exceeded Wall Street’s estimates by 2.6%.
Looking ahead, sell-side analysts expect revenue to grow 5.2% over the next 12 months, a deceleration versus the last two years. This projection is underwhelming and indicates its products and services will see some demand headwinds. At least the company is tracking well in other measures of financial health.
Software is eating the world and there is virtually no industry left that has been untouched by it. That drives increasing demand for tools helping software developers do their jobs, whether it be monitoring critical cloud infrastructure, integrating audio and video functionality, or ensuring smooth content streaming. Click here to access a free report on our 3 favorite stocks to play this generational megatrend.
Operating Margin
ITT has been a well-oiled machine over the last five years. It demonstrated elite profitability for an industrials business, boasting an average operating margin of 17.5%. This result isn’t too surprising as its gross margin gives it a favorable starting point.
Looking at the trend in its profitability, ITT’s operating margin decreased by 2.3 percentage points over the last five years. This raises questions about the company’s expense base because its revenue growth should have given it leverage on its fixed costs, resulting in better economies of scale and profitability.
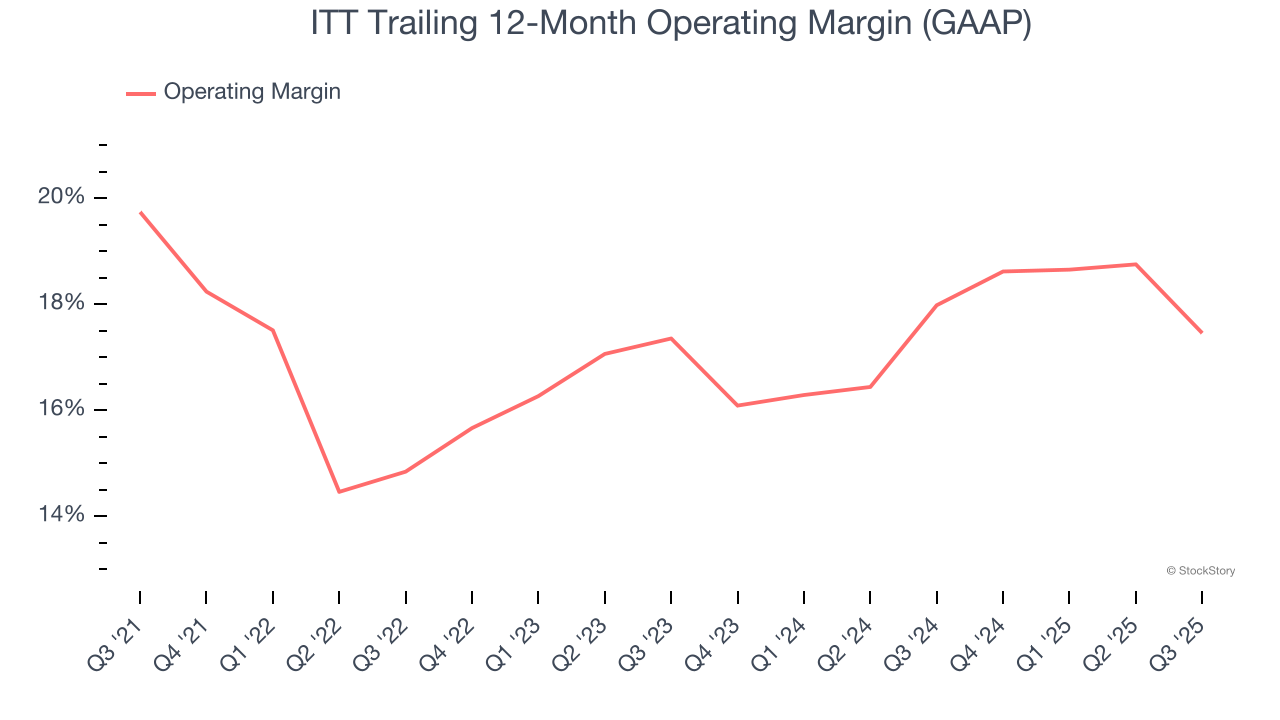
This quarter, ITT generated an operating margin profit margin of 18%, down 5.5 percentage points year on year. Since ITT’s operating margin decreased more than its gross margin, we can assume it was less efficient because expenses such as marketing, R&D, and administrative overhead increased.
Earnings Per Share
We track the long-term change in earnings per share (EPS) for the same reason as long-term revenue growth. Compared to revenue, however, EPS highlights whether a company’s growth is profitable.
ITT’s EPS grew at a spectacular 14.9% compounded annual growth rate over the last five years, higher than its 8.9% annualized revenue growth. This tells us the company became more profitable on a per-share basis as it expanded.
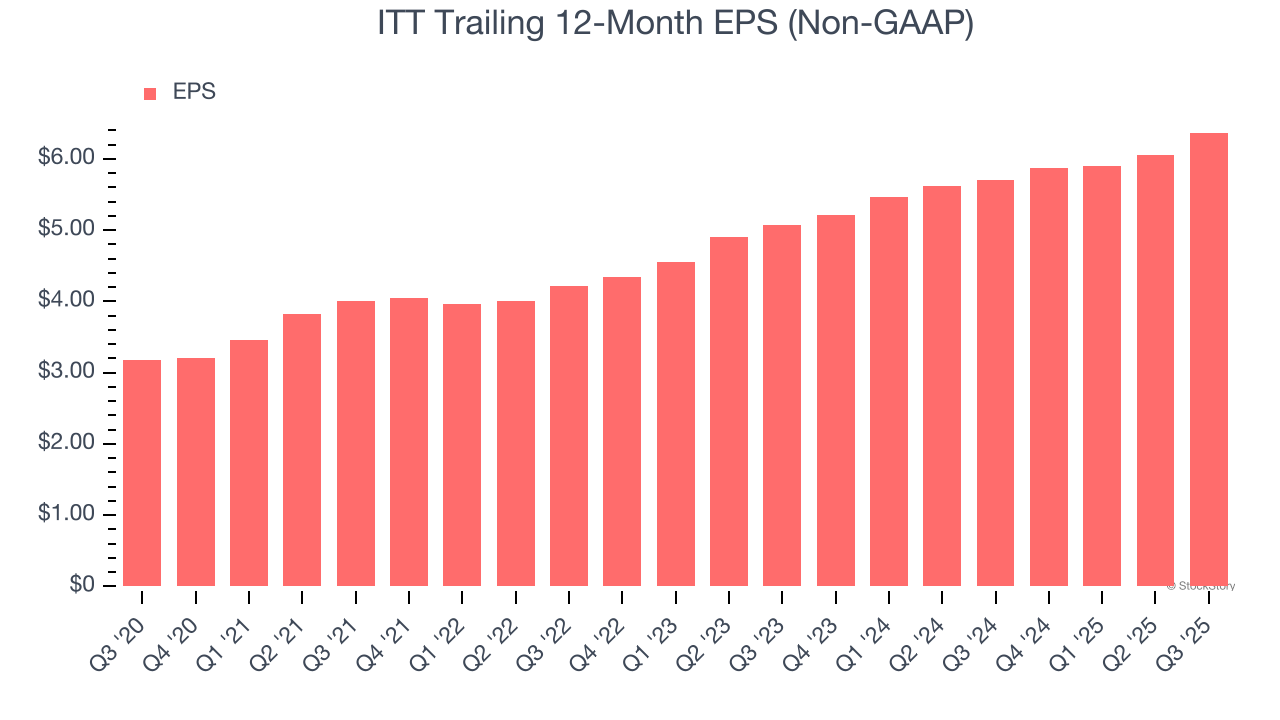
Diving into the nuances of ITT’s earnings can give us a better understanding of its performance. A five-year view shows that ITT has repurchased its stock, shrinking its share count by 9.3%. This tells us its EPS outperformed its revenue not because of increased operational efficiency but financial engineering, as buybacks boost per share earnings. 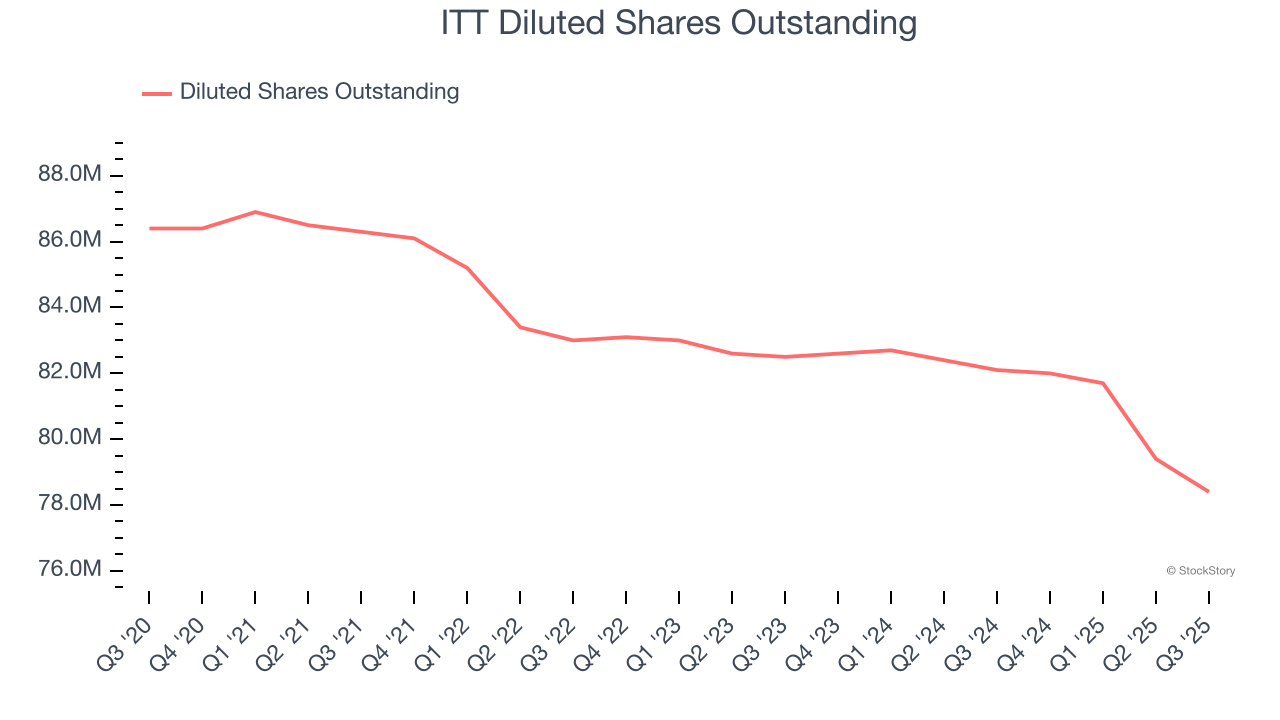
Like with revenue, we analyze EPS over a more recent period because it can provide insight into an emerging theme or development for the business.
For ITT, its two-year annual EPS growth of 12.1% was lower than its five-year trend. We still think its growth was good and hope it can accelerate in the future.
In Q3, ITT reported adjusted EPS of $1.78, up from $1.46 in the same quarter last year. This print beat analysts’ estimates by 6.7%. Over the next 12 months, Wall Street expects ITT’s full-year EPS of $6.37 to grow 10.7%.
Key Takeaways from ITT’s Q3 Results
We enjoyed seeing ITT beat analysts’ organic revenue expectations this quarter. We were also glad its revenue outperformed Wall Street’s estimates. Looking ahead, EPS guidance for the full year was also raised. Zooming out, we think this quarter featured some important positives. The stock traded up 3.5% to $182.28 immediately after reporting.
Sure, ITT had a solid quarter, but if we look at the bigger picture, is this stock a buy? When making that decision, it’s important to consider its valuation, business qualities, as well as what has happened in the latest quarter. We cover that in our actionable full research report which you can read here, it’s free for active Edge members.


