Marine transportation service company Kirby (NYSE: KEX) reported Q3 CY2025 results beating Wall Street’s revenue expectations, with sales up 4.8% year on year to $871.2 million. Its GAAP profit of $1.65 per share was 2.2% above analysts’ consensus estimates.
Is now the time to buy Kirby? Find out by accessing our full research report, it’s free for active Edge members.
Kirby (KEX) Q3 CY2025 Highlights:
- Revenue: $871.2 million vs analyst estimates of $851.2 million (4.8% year-on-year growth, 2.3% beat)
- EPS (GAAP): $1.65 vs analyst estimates of $1.62 (2.2% beat)
- Adjusted EBITDA: $201.4 million vs analyst estimates of $193.5 million (23.1% margin, 4.1% beat)
- Operating Margin: 14.8%, in line with the same quarter last year
- Free Cash Flow Margin: 18.4%, up from 15.7% in the same quarter last year
- Market Capitalization: $4.95 billion
David Grzebinski, Kirby’s Chief Executive Officer, commented, “Kirby’s third quarter performance reflects our ability to adapt and deliver results, with continued strength in coastal marine and power generation, and focused execution in the face of softer inland market conditions.”
Company Overview
Transporting goods along all U.S. coasts, Kirby (NYSE: KEX) provides inland and coastal marine transportation services.
Revenue Growth
Reviewing a company’s long-term sales performance reveals insights into its quality. Any business can put up a good quarter or two, but many enduring ones grow for years. Regrettably, Kirby’s sales grew at a mediocre 7.2% compounded annual growth rate over the last five years. This fell short of our benchmark for the industrials sector and is a tough starting point for our analysis.
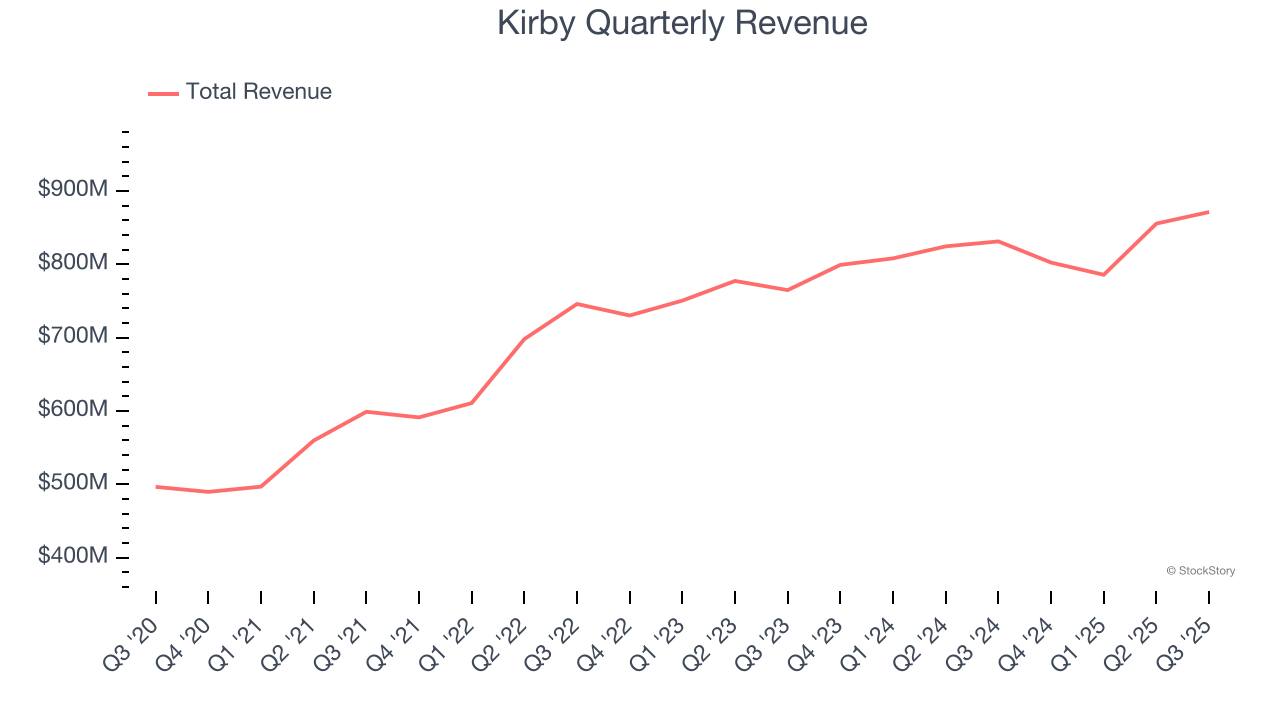
Long-term growth is the most important, but within industrials, a half-decade historical view may miss new industry trends or demand cycles. Kirby’s recent performance shows its demand has slowed as its annualized revenue growth of 4.7% over the last two years was below its five-year trend. We also note many other Marine Transportation businesses have faced declining sales because of cyclical headwinds. While Kirby grew slower than we’d like, it did do better than its peers. 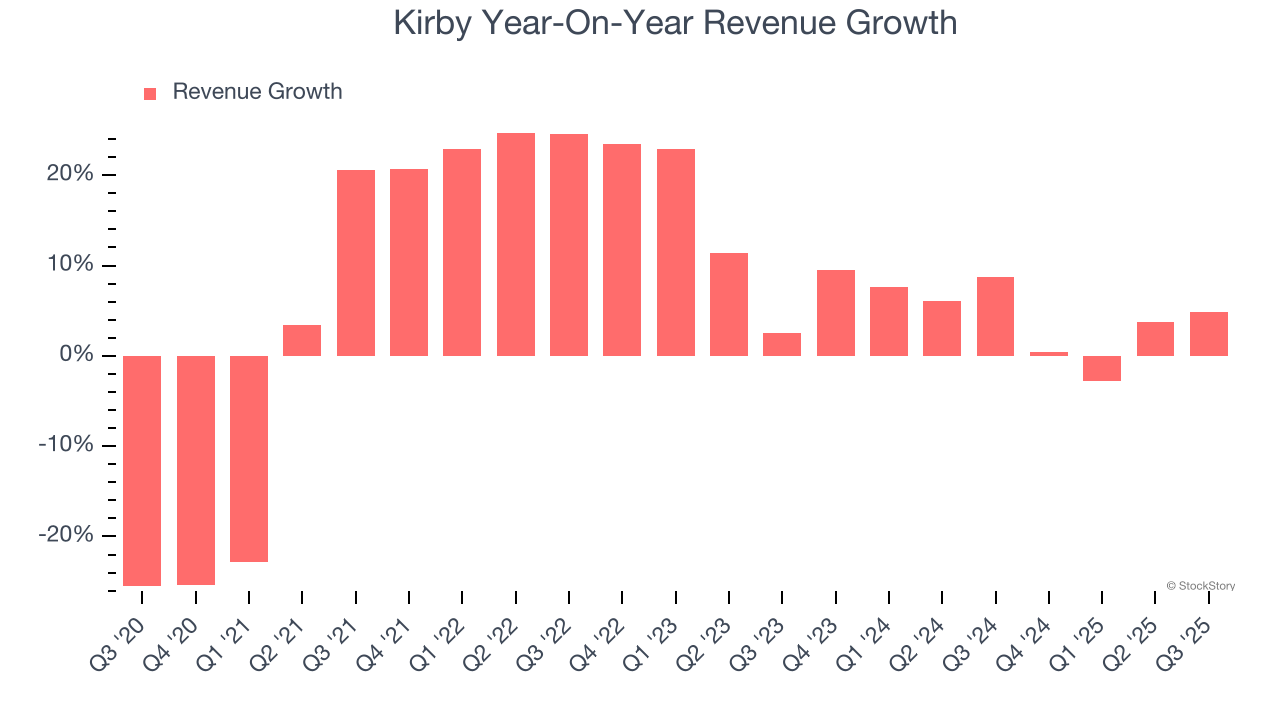
We can better understand the company’s revenue dynamics by analyzing its most important segments, Marine Transportation and Distribution and Services, which are 55.7% and 44.3% of revenue. Over the last two years, Kirby’s Marine Transportation revenue (petroleum products and chemicals) averaged 6.7% year-on-year growth while its Distribution and Services revenue (aftermarket parts and equipment) averaged 2.5% growth. 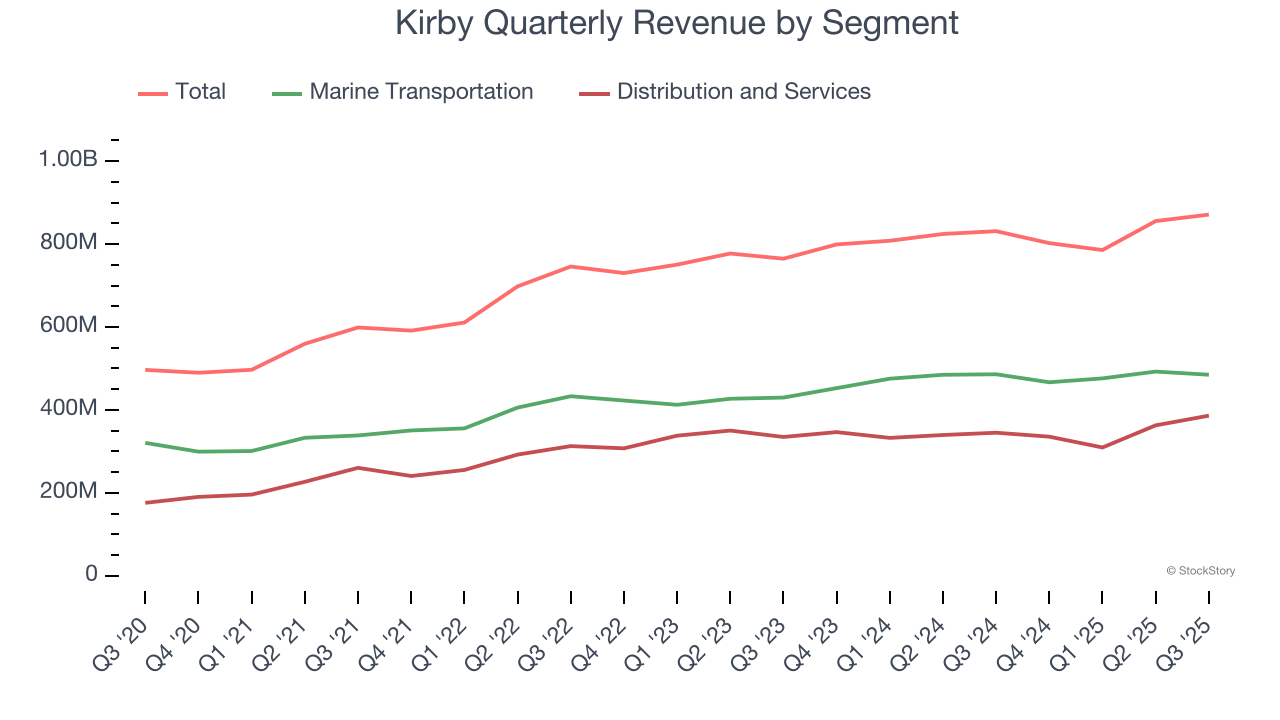
This quarter, Kirby reported modest year-on-year revenue growth of 4.8% but beat Wall Street’s estimates by 2.3%.
Looking ahead, sell-side analysts expect revenue to grow 4.1% over the next 12 months, similar to its two-year rate. This projection doesn't excite us and indicates its newer products and services will not catalyze better top-line performance yet.
Unless you’ve been living under a rock, it should be obvious by now that generative AI is going to have a huge impact on how large corporations do business. While Nvidia and AMD are trading close to all-time highs, we prefer a lesser-known (but still profitable) stock benefiting from the rise of AI. Click here to access our free report one of our favorites growth stories.
Operating Margin
Kirby was profitable over the last five years but held back by its large cost base. Its average operating margin of 7.4% was weak for an industrials business. This result isn’t too surprising given its low gross margin as a starting point.
On the plus side, Kirby’s operating margin rose by 24.9 percentage points over the last five years, as its sales growth gave it operating leverage. We’ll take Kirby’s improvement as many Marine Transportation companies saw their margins fall (along with revenue, as mentioned above) because the cycle turned in the wrong direction.
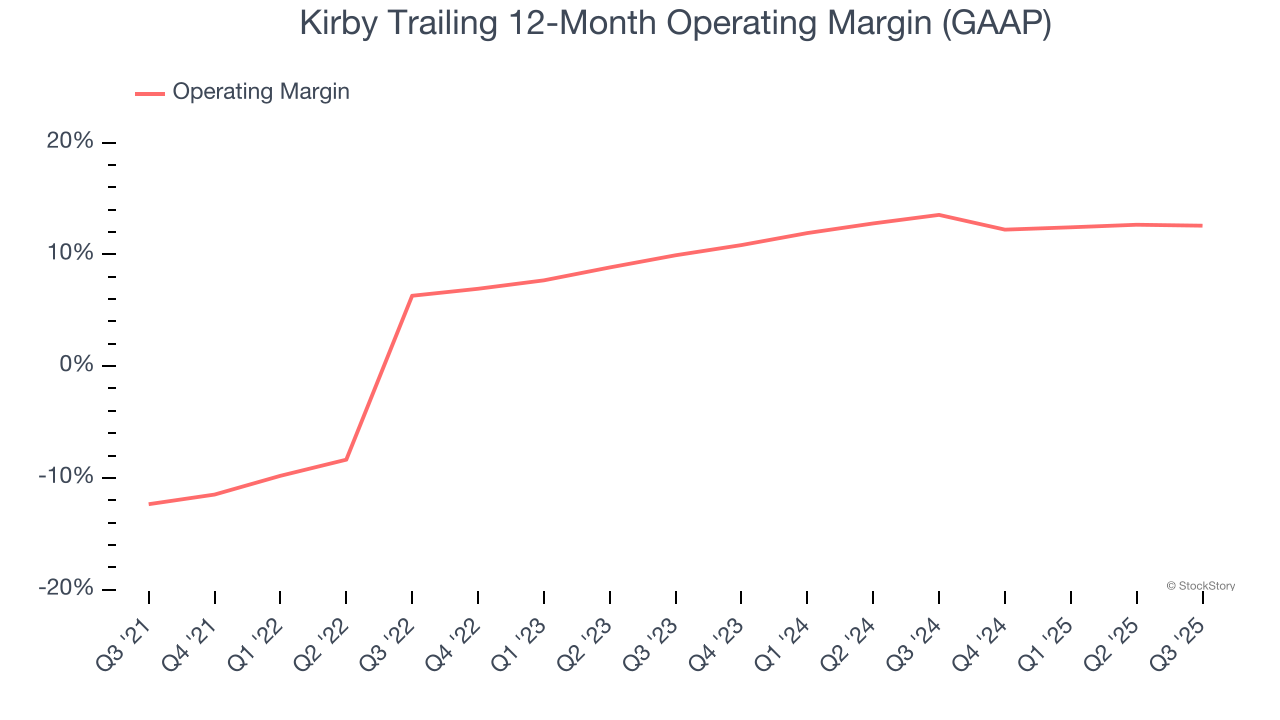
This quarter, Kirby generated an operating margin profit margin of 14.8%, in line with the same quarter last year. This indicates the company’s cost structure has recently been stable.
Earnings Per Share
We track the long-term change in earnings per share (EPS) for the same reason as long-term revenue growth. Compared to revenue, however, EPS highlights whether a company’s growth is profitable.
Kirby’s full-year EPS flipped from negative to positive over the last five years. This is encouraging and shows it’s at a critical moment in its life.
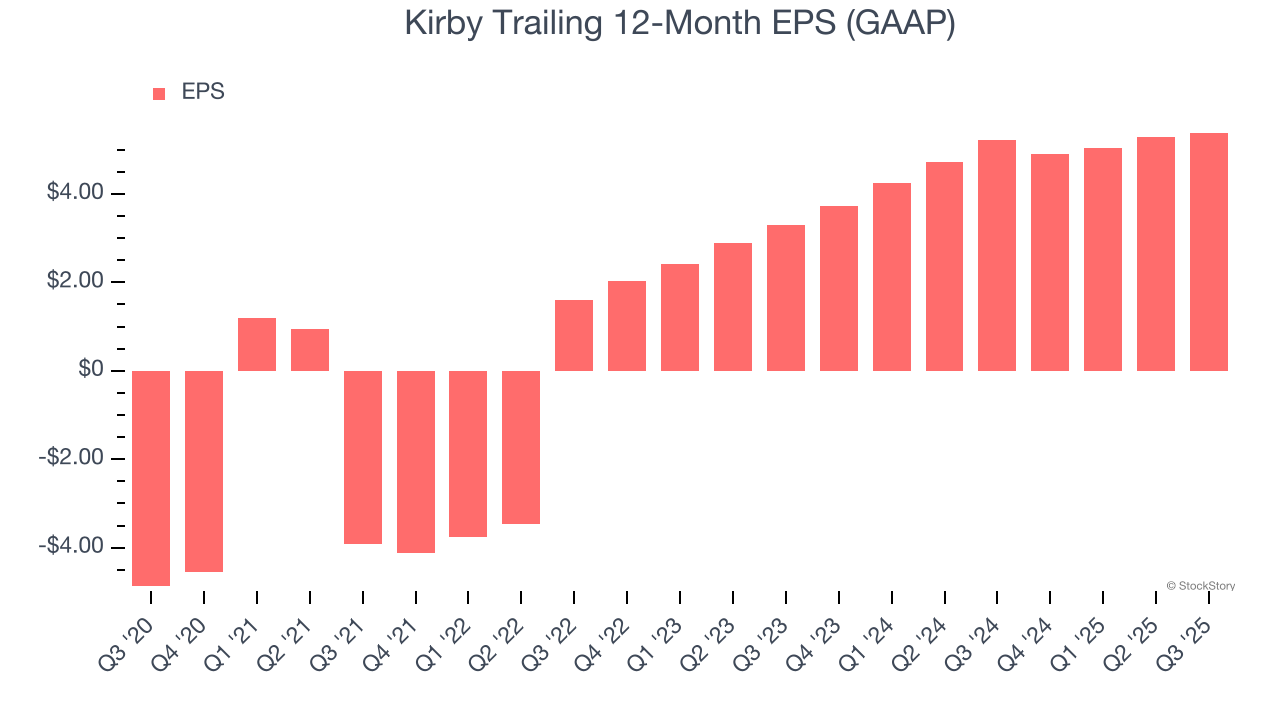
Like with revenue, we analyze EPS over a more recent period because it can provide insight into an emerging theme or development for the business.
Kirby’s EPS grew at an astounding 27.7% compounded annual growth rate over the last two years, higher than its 4.7% annualized revenue growth. This tells us the company became more profitable on a per-share basis as it expanded.
We can take a deeper look into Kirby’s earnings quality to better understand the drivers of its performance. While we mentioned earlier that Kirby’s operating margin was flat this quarter, a two-year view shows its margin has expandedwhile its share count has shrunk 6.3%. These are positive signs for shareholders because improving profitability and share buybacks turbocharge EPS growth relative to revenue growth. 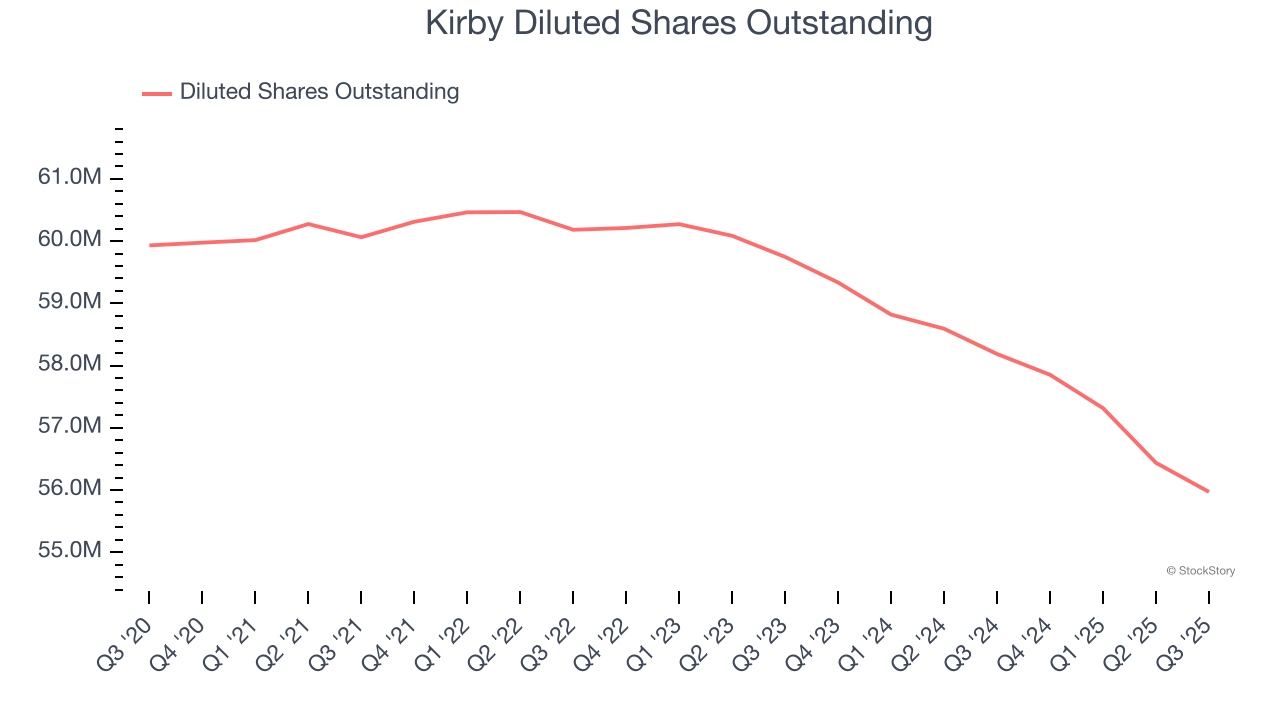
In Q3, Kirby reported EPS of $1.65, up from $1.55 in the same quarter last year. This print beat analysts’ estimates by 2.2%. Over the next 12 months, Wall Street expects Kirby’s full-year EPS of $5.39 to grow 24.7%.
Key Takeaways from Kirby’s Q3 Results
We were glad Kirby's revenue and EPS both outperformed Wall Street’s estimates. Overall, we think this was a solid quarter with some key areas of upside. The stock traded up 1.4% to $90 immediately after reporting.
Kirby put up rock-solid earnings, but one quarter doesn’t necessarily make the stock a buy. Let’s see if this is a good investment. What happened in the latest quarter matters, but not as much as longer-term business quality and valuation, when deciding whether to invest in this stock. We cover that in our actionable full research report which you can read here, it’s free for active Edge members.