
Cash management services provider Brink's (NYSE: BCO) beat Wall Street’s revenue expectations in Q4 CY2025, with sales up 9.1% year on year to $1.38 billion. Guidance for next quarter’s revenue was optimistic at $1.37 billion at the midpoint, 2.6% above analysts’ estimates. Its non-GAAP profit of $2.54 per share was 2.7% above analysts’ consensus estimates.
Is now the time to buy Brink's? Find out by accessing our full research report, it’s free.
Brink's (BCO) Q4 CY2025 Highlights:
- Revenue: $1.38 billion vs analyst estimates of $1.35 billion (9.1% year-on-year growth, 1.8% beat)
- Adjusted EPS: $2.54 vs analyst estimates of $2.47 (2.7% beat)
- Adjusted EBITDA: $277 million vs analyst estimates of $276.7 million (20.1% margin, in line)
- Revenue Guidance for Q1 CY2026 is $1.37 billion at the midpoint, above analyst estimates of $1.33 billion
- Adjusted EPS guidance for Q1 CY2026 is $1.70 at the midpoint, roughly in line with what analysts were expecting
- EBITDA guidance for Q1 CY2026 is $230 million at the midpoint, above analyst estimates of $227.5 million
- Operating Margin: 13.1%, down from 16.8% in the same quarter last year
- Free Cash Flow Margin: 23.6%, similar to the same quarter last year
- Market Capitalization: $5.38 billion
Mark Eubanks, president and CEO, said: “Supported by a strong fourth quarter, Brink's took another significant step forward in our strategic execution in 2025. We continue to methodically transform Brink's into a faster growing, more profitable and higher cash flow generating business supported by growth in our recurring AMS / DRS customer offerings. In the fourth quarter, AMS / DRS growth accelerated to 22% organically, driving EBITDA margin expansion and over $260 million of free cash flow generation. In 2025, we delivered $977 million of adjusted EBITDA with 40 basis points of margin expansion to 18.6%. EBITDA growth was highlighted by record margin performance in our North America and Europe segments where AMS / DRS growth is driving mix penetration, and our productivity initiatives continue to mature. Free cash flow conversion of 45% was at the top end of our full-year framework. The strong cash performance allowed us to return over $250 million to shareholders through our dividend and share repurchase plan while reducing our net debt leverage to 2.7 times EBITDA. "
Company Overview
Known for its iconic armored trucks that have been a fixture in American cities since 1859, Brink's (NYSE: BCO) provides secure transportation and management of cash and valuables for banks, retailers, and other businesses worldwide.
Revenue Growth
Reviewing a company’s long-term sales performance reveals insights into its quality. Any business can experience short-term success, but top-performing ones enjoy sustained growth for years.
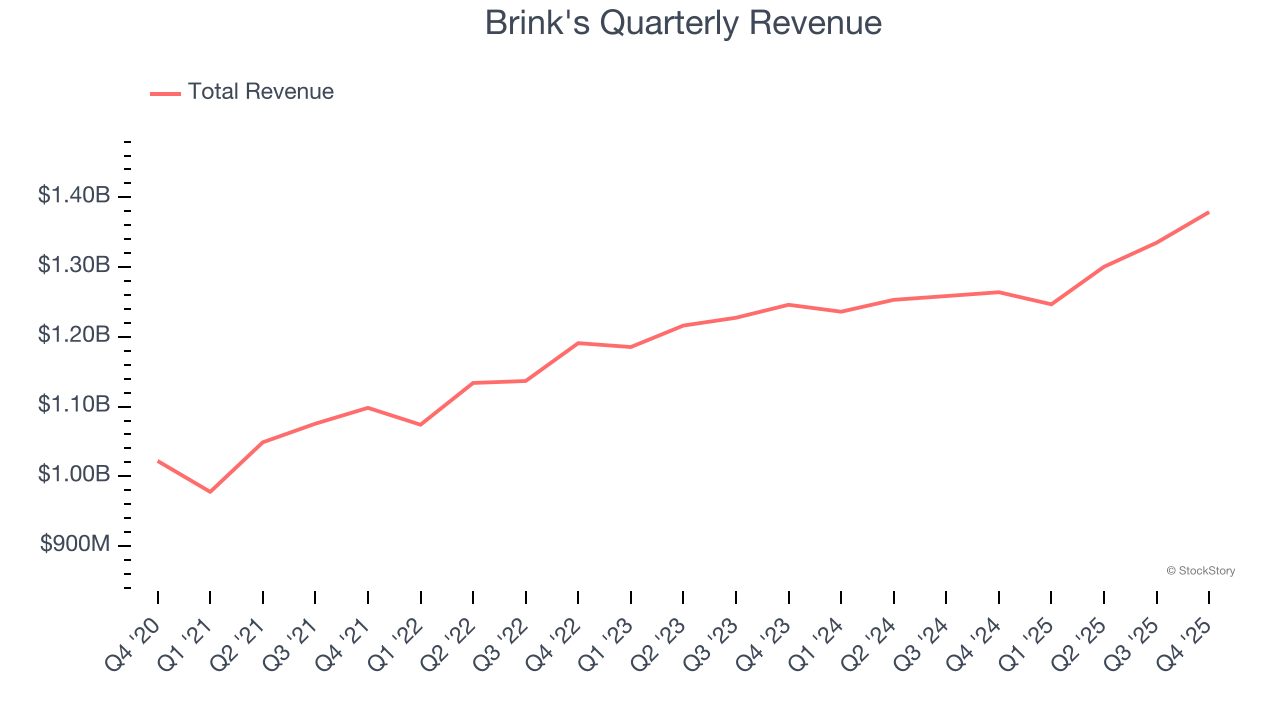
With $5.26 billion in revenue over the past 12 months, Brink's is one of the larger companies in the business services industry and benefits from a well-known brand that influences purchasing decisions.
As you can see below, Brink’s sales grew at a solid 7.3% compounded annual growth rate over the last five years. This is an encouraging starting point for our analysis because it shows Brink’s demand was higher than many business services companies.
Long-term growth is the most important, but within business services, a half-decade historical view may miss new innovations or demand cycles. Brink’s recent performance shows its demand has slowed as its annualized revenue growth of 3.9% over the last two years was below its five-year trend. We’re wary when companies in the sector see decelerations in revenue growth, as it could signal changing consumer tastes aided by low switching costs. 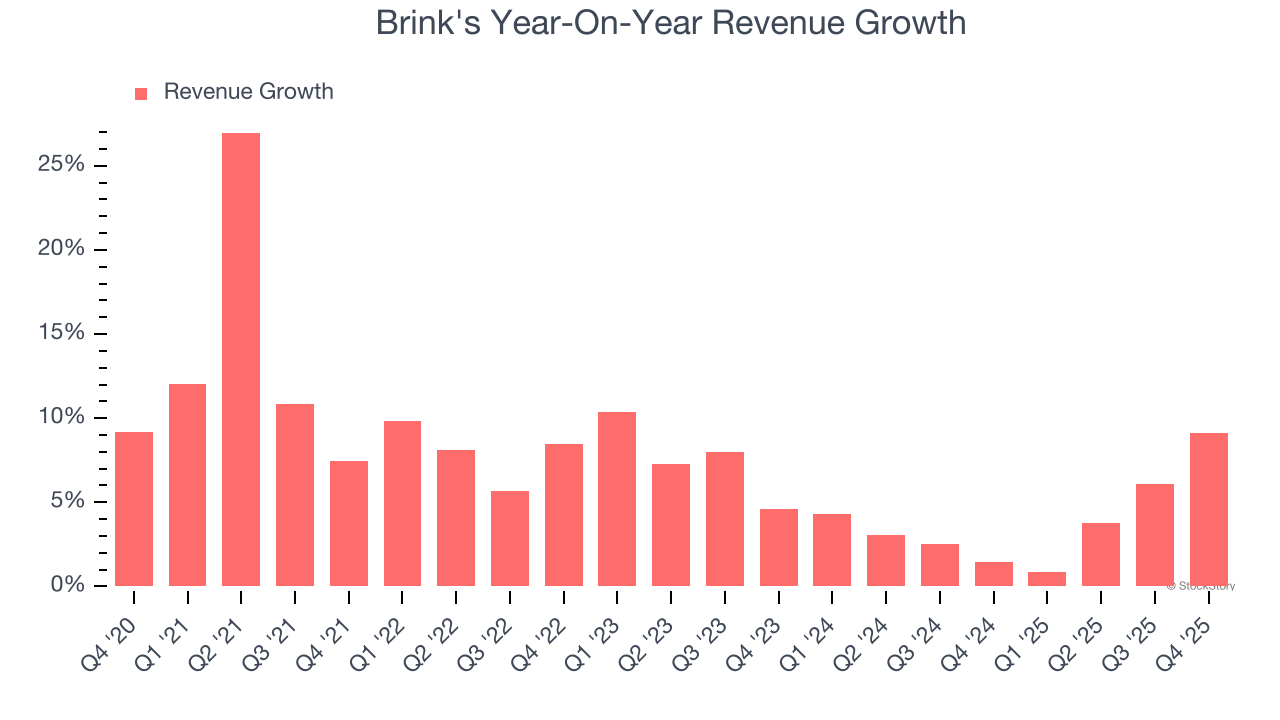
This quarter, Brink's reported year-on-year revenue growth of 9.1%, and its $1.38 billion of revenue exceeded Wall Street’s estimates by 1.8%. Company management is currently guiding for a 9.5% year-on-year increase in sales next quarter.
Looking further ahead, sell-side analysts expect revenue to grow 4.5% over the next 12 months, similar to its two-year rate. This projection is underwhelming and suggests its newer products and services will not accelerate its top-line performance yet. At least the company is tracking well in other measures of financial health.
Microsoft, Alphabet, Coca-Cola, Monster Beverage—all began as under-the-radar growth stories riding a massive trend. We’ve identified the next one: a profitable AI semiconductor play Wall Street is still overlooking. Go here for access to our full report.
Operating Margin
Operating margin is a key measure of profitability. Think of it as net income - the bottom line - excluding the impact of taxes and interest on debt, which are less connected to business fundamentals.
Brink's was profitable over the last five years but held back by its large cost base. Its average operating margin of 9.4% was weak for a business services business.
On the plus side, Brink’s operating margin rose by 4.4 percentage points over the last five years, as its sales growth gave it operating leverage.
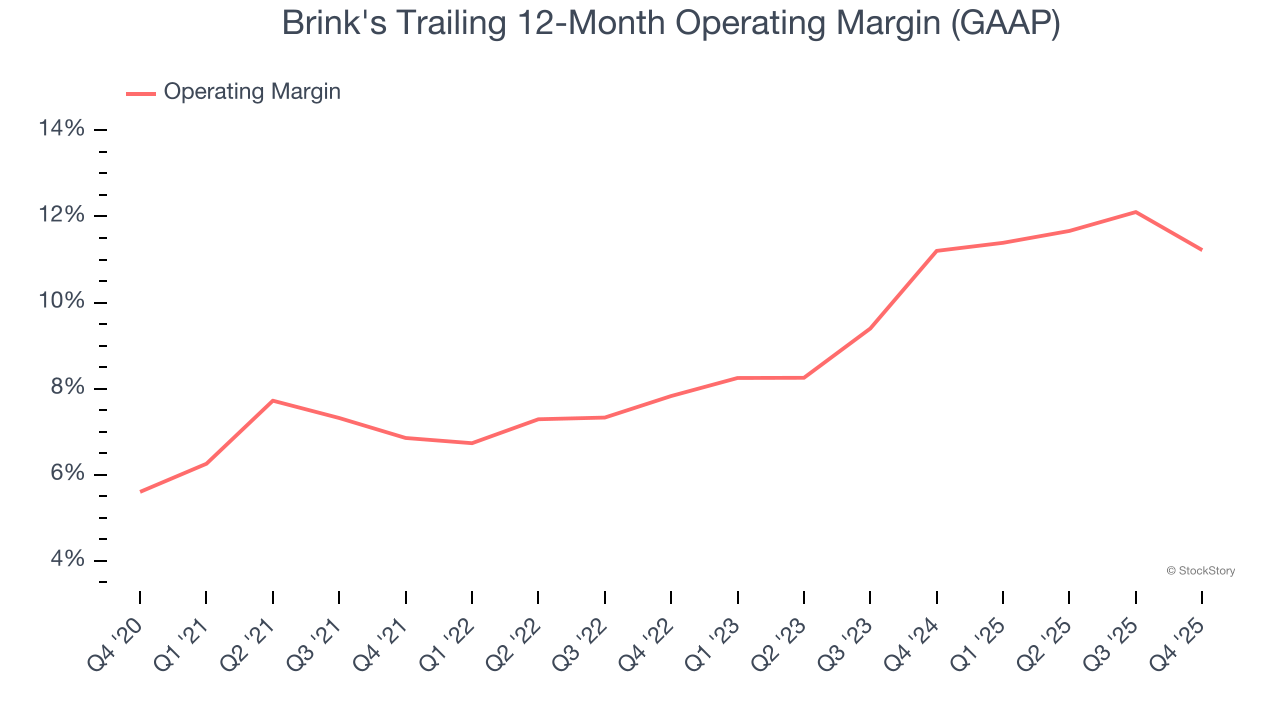
In Q4, Brink's generated an operating margin profit margin of 13.1%, down 3.8 percentage points year on year. This contraction shows it was less efficient because its expenses grew faster than its revenue.
Earnings Per Share
We track the long-term change in earnings per share (EPS) for the same reason as long-term revenue growth. Compared to revenue, however, EPS highlights whether a company’s growth is profitable.
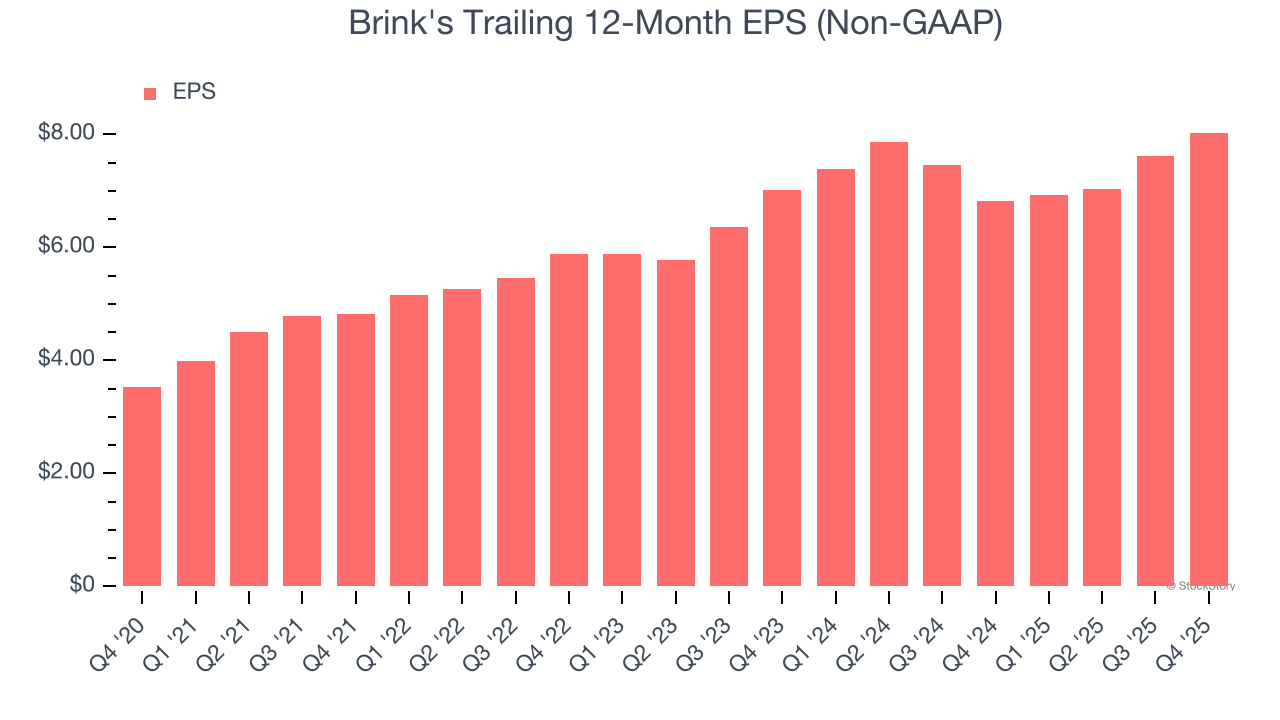
Brink’s EPS grew at an astounding 17.9% compounded annual growth rate over the last five years, higher than its 7.3% annualized revenue growth. This tells us the company became more profitable on a per-share basis as it expanded.
Diving into the nuances of Brink’s earnings can give us a better understanding of its performance. As we mentioned earlier, Brink’s operating margin declined this quarter but expanded by 4.4 percentage points over the last five years. This was the most relevant factor (aside from the revenue impact) behind its higher earnings; interest expenses and taxes can also affect EPS but don’t tell us as much about a company’s fundamentals.
Like with revenue, we analyze EPS over a more recent period because it can provide insight into an emerging theme or development for the business.
For Brink's, its two-year annual EPS growth of 7% was lower than its five-year trend. This wasn’t great, but at least the company was successful in other measures of financial health.
In Q4, Brink's reported adjusted EPS of $2.54, up from $2.12 in the same quarter last year. This print beat analysts’ estimates by 2.7%. Over the next 12 months, Wall Street expects Brink’s full-year EPS of $8.03 to grow 13.4%.
Key Takeaways from Brink’s Q4 Results
We were impressed by Brink’s optimistic revenue guidance for next quarter, which blew past analysts’ expectations. However, EPS guidance for the coming quarter was just in line. We were also happy its revenue outperformed Wall Street’s estimates. Overall, we think this was a solid quarter with some key areas of upside. Investors were likely hoping for more, and shares traded down 6.3% to $127 immediately following the results.
Is Brink's an attractive investment opportunity at the current price? When making that decision, it’s important to consider its valuation, business qualities, as well as what has happened in the latest quarter. We cover that in our actionable full research report which you can read here (it’s free).