
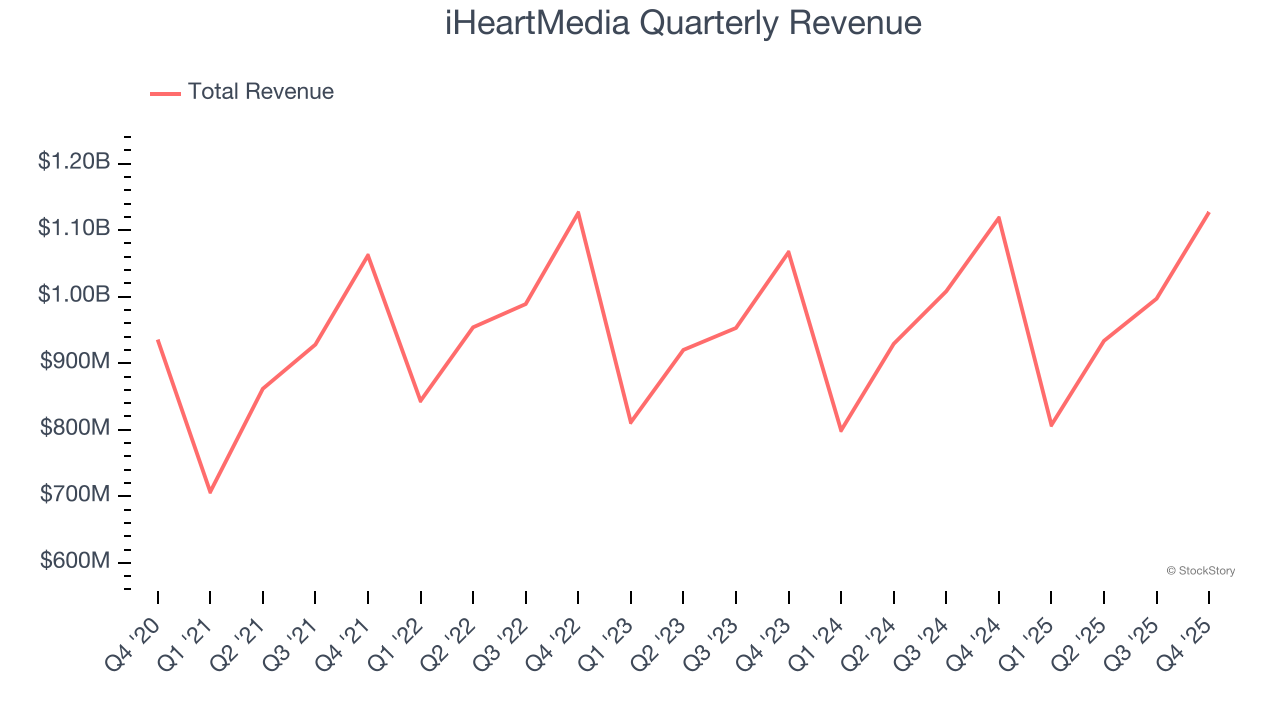
Global media and entertainment company iHeartMedia (NASDAQ: IHRT) beat Wall Street’s revenue expectations in Q4 CY2025, but sales were flat year on year at $1.13 billion. Its GAAP loss of $0.27 per share was significantly below analysts’ consensus estimates.
Is now the time to buy iHeartMedia? Find out by accessing our full research report, it’s free.
iHeartMedia (IHRT) Q4 CY2025 Highlights:
- Revenue: $1.13 billion vs analyst estimates of $1.10 billion (flat year on year, 2.8% beat)
- EPS (GAAP): -$0.27 vs analyst estimates of $0.13 (significant miss)
- Adjusted EBITDA: $220.3 million vs analyst estimates of $226.9 million (19.5% margin, 2.9% miss)
- EBITDA guidance for the upcoming financial year 2026 is $800 million at the midpoint, below analyst estimates of $861.7 million
- Operating Margin: 7.6%, down from 9.3% in the same quarter last year
- Free Cash Flow was $137.6 million, up from -$24.21 million in the same quarter last year
- Market Capitalization: $469.8 million
“We’re pleased with our fourth quarter results, generating Adjusted EBITDA of $220 million, at the midpoint of our previously provided guidance range, and our consolidated revenue was $1.1 billion, up 0.8% compared to prior year and above our guidance; excluding the impact of political, our consolidated revenue was up 7.7%,” said Bob Pittman, Chairman and CEO of iHeartMedia, Inc.
Company Overview
Occasionally featuring celebrity hosts like Ryan Seacrest on its shows, iHeartMedia (NASDAQ: IHRT) is a leading multimedia company renowned for its extensive network of radio stations, digital platforms, and live events across the globe.
Revenue Growth
A company’s long-term sales performance can indicate its overall quality. Any business can put up a good quarter or two, but many enduring ones grow for years. Regrettably, iHeartMedia’s sales grew at a weak 5.6% compounded annual growth rate over the last five years. This fell short of our benchmark for the consumer discretionary sector and is a tough starting point for our analysis.
We at StockStory place the most emphasis on long-term growth, but within consumer discretionary, a stretched historical view may miss a company riding a successful new product or trend. iHeartMedia’s recent performance shows its demand has slowed as its annualized revenue growth of 1.5% over the last two years was below its five-year trend. We’re wary when companies in the sector see decelerations in revenue growth, as it could signal changing consumer tastes aided by low switching costs. 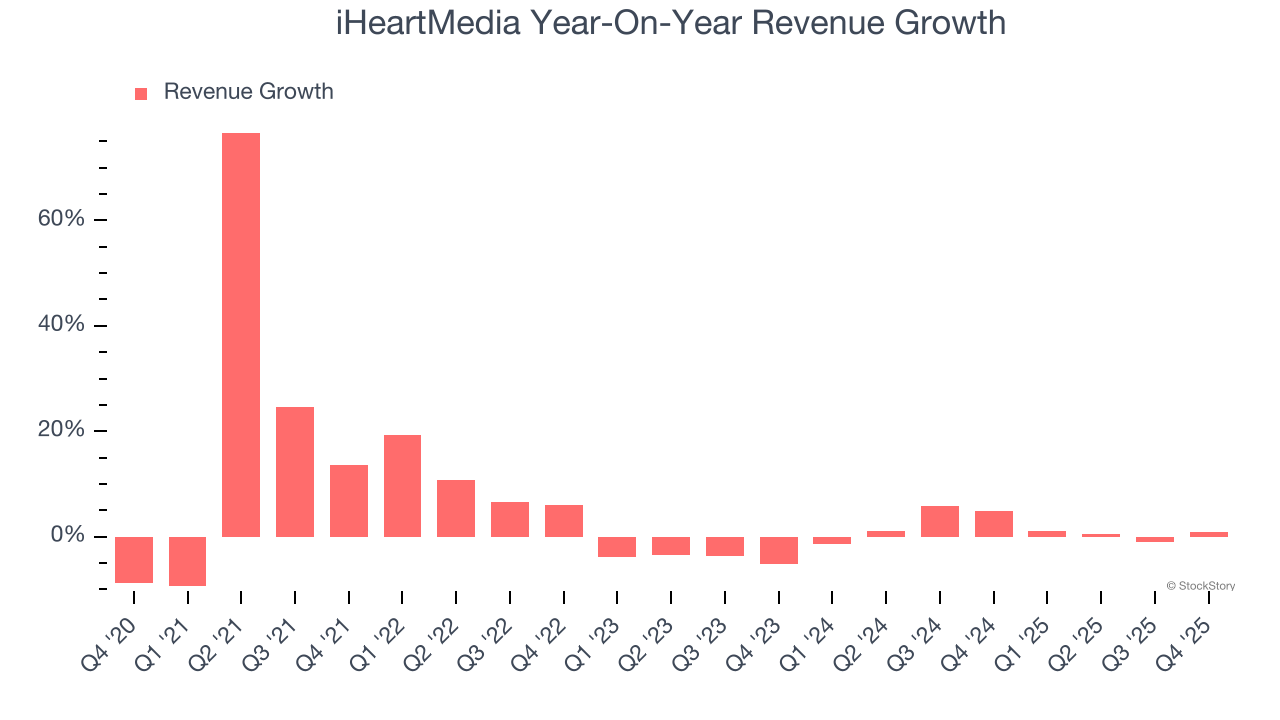
We can dig further into the company’s revenue dynamics by analyzing its three most important segments: Multiplatform, Digital Audio, and Services, which are 59%, 34.3%, and 7% of revenue. Over the last two years, iHeartMedia’s Digital Audio revenue (podcasting) averaged 14.3% year-on-year growth while its Multiplatform (broadcasting, networks, events) and Services (media representation) revenues averaged 4.2% and 15.7% declines. 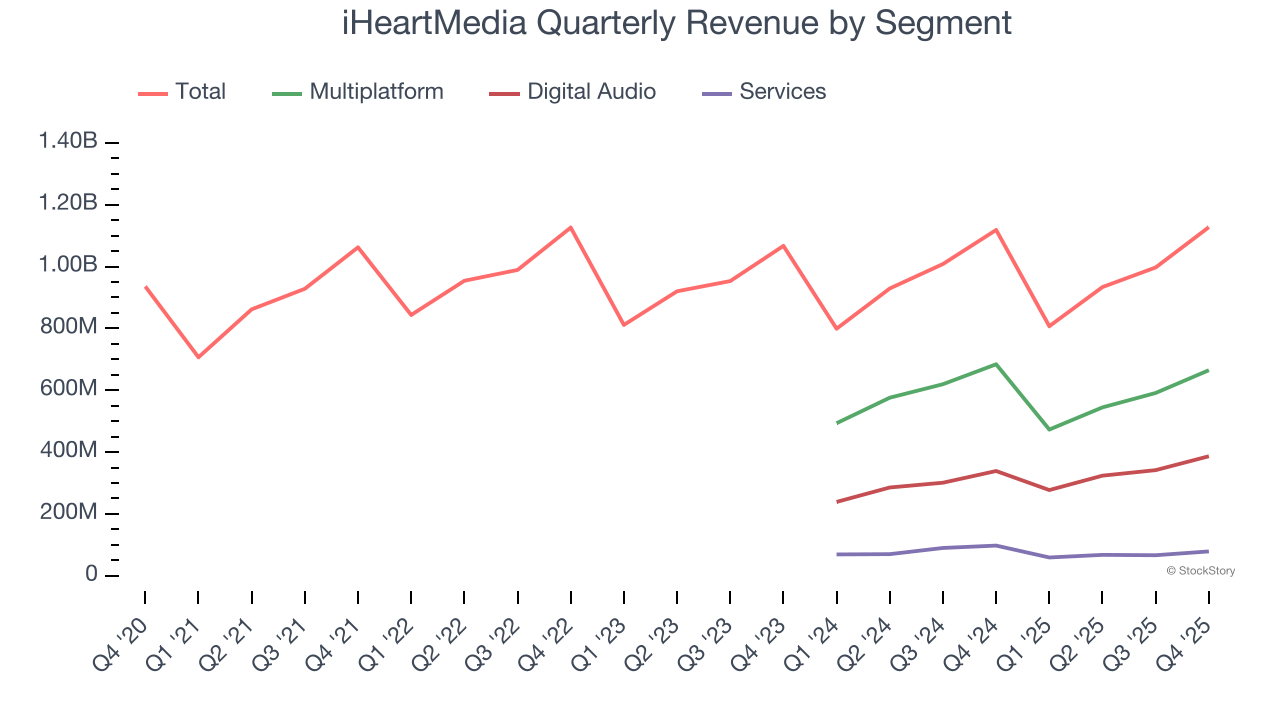
This quarter, iHeartMedia’s $1.13 billion of revenue was flat year on year but beat Wall Street’s estimates by 2.8%.
Looking ahead, sell-side analysts expect revenue to grow 5.4% over the next 12 months. While this projection indicates its newer products and services will spur better top-line performance, it is still below average for the sector.
ONE MORE THING: 3 Hidden Platforms Growing 3X Faster than Amazon, Google, and PayPal. Amazon, Google, and Meta all followed the same playbook: Dominate an ignored market. Build an unbeatable moat. Scale until you’re unstoppable.
These three platforms are running that exact playbook right now. The early investors in Amazon made fortunes. The early investors in these could do the same. Get All 3 Stocks Here for FREE.
Operating Margin
Operating margin is a key measure of profitability. Think of it as net income - the bottom line - excluding the impact of taxes and interest on debt, which are less connected to business fundamentals.
iHeartMedia’s operating margin has been trending up over the last 12 months, but it still averaged negative 10.2% over the last two years. This is due to its large expense base and inefficient cost structure.
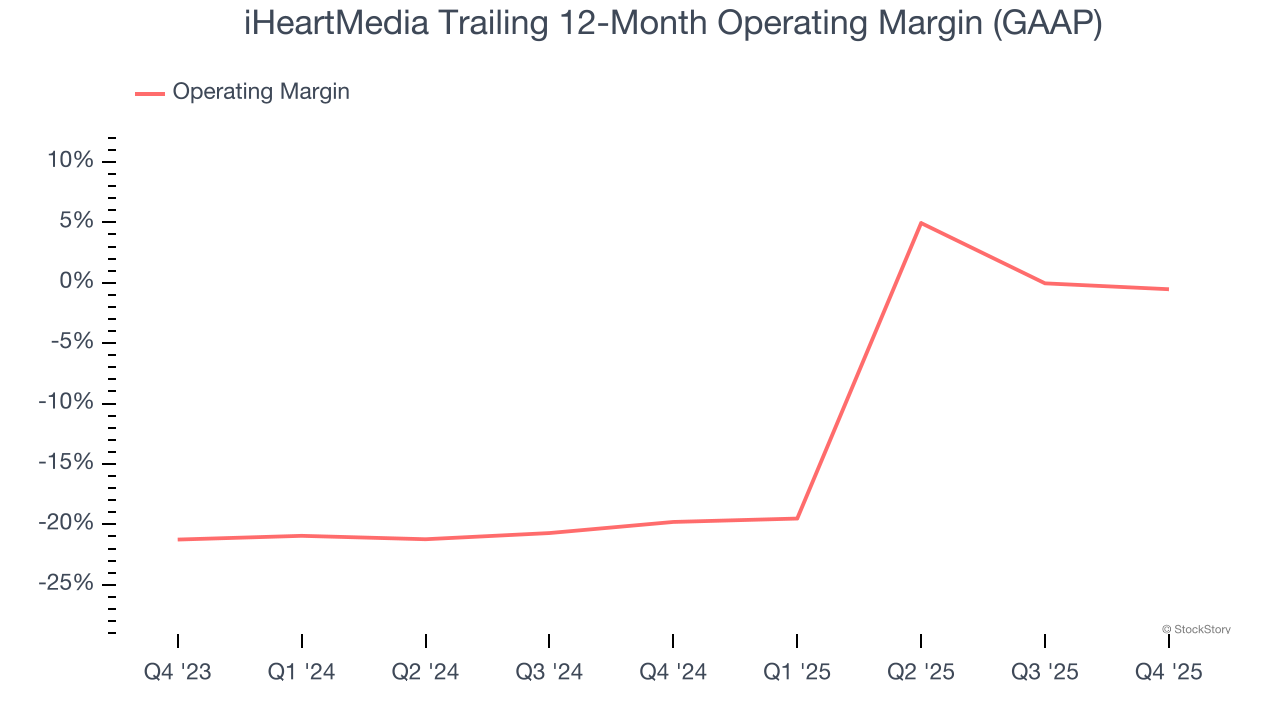
This quarter, iHeartMedia generated an operating margin profit margin of 7.6%, down 1.7 percentage points year on year. This reduction is quite minuscule and indicates the company’s overall cost structure has been relatively stable.
Earnings Per Share
Revenue trends explain a company’s historical growth, but the long-term change in earnings per share (EPS) points to the profitability of that growth – for example, a company could inflate its sales through excessive spending on advertising and promotions.
Although iHeartMedia’s full-year earnings are still negative, it reduced its losses and improved its EPS by 25.2% annually over the last five years. The next few quarters will be critical for assessing its long-term profitability.
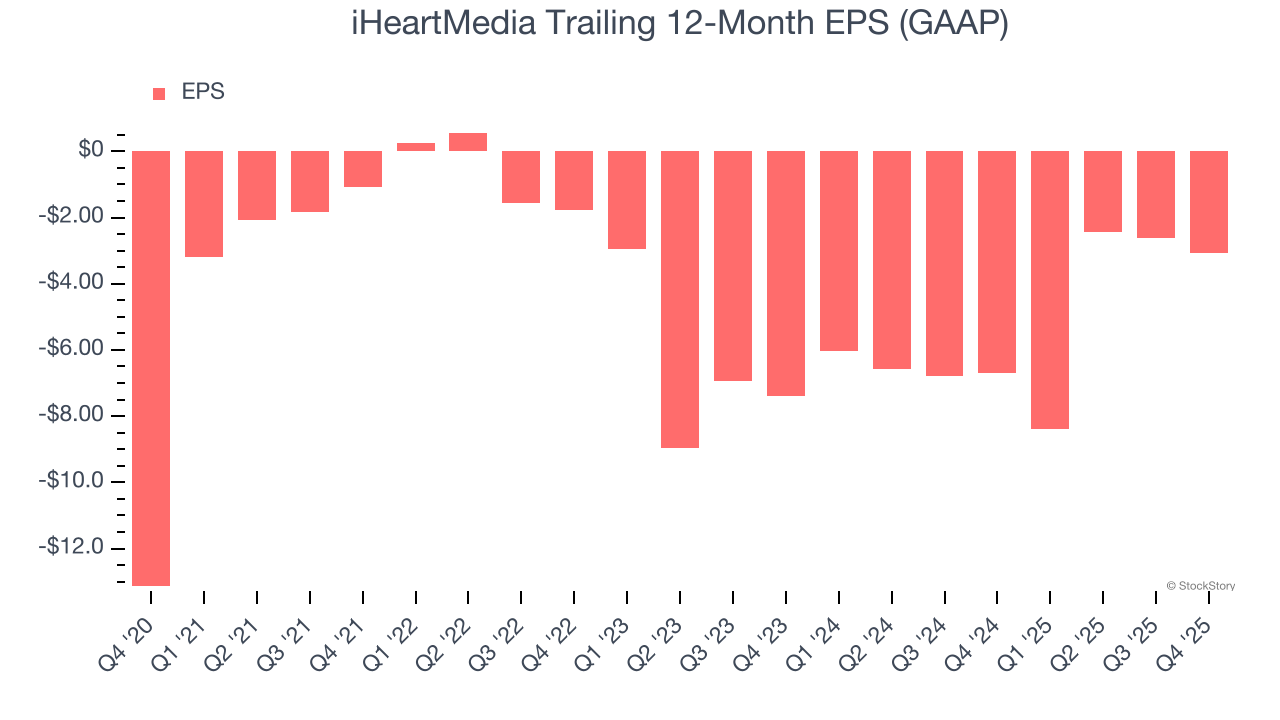
In Q4, iHeartMedia reported EPS of negative $0.27, down from $0.21 in the same quarter last year. This print missed analysts’ estimates. Over the next 12 months, Wall Street is optimistic. Analysts forecast iHeartMedia’s full-year EPS of negative $3.08 will flip to positive $0.53.
Key Takeaways from iHeartMedia’s Q4 Results
It was encouraging to see iHeartMedia beat analysts’ revenue expectations this quarter. On the other hand, its EPS missed and its full-year EBITDA guidance fell short of Wall Street’s estimates. Overall, this was a softer quarter. The stock traded down 1.8% to $3.06 immediately following the results.
iHeartMedia underperformed this quarter, but does that create an opportunity to invest right now? The latest quarter does matter, but not nearly as much as longer-term fundamentals and valuation, when deciding if the stock is a buy. We cover that in our actionable full research report which you can read here (it’s free).