
It’s been an exciting start to December for silver (SLV) investors, with the metal being one of the best-performing assets for the month, up over 14% in the past 15 trading days alone. This sharp recovery off the lows for the metal has helped keep the silver/gold ratio in a clear uptrend, and typically this has been a bullish sign for the metals complex.
While the sharp spike in bullish sentiment is not ideal, it’s important to note that long-term sentiment still remains well below the neutral zone, with bears outnumbering bulls by a 2 to 1 basis. For now, though, the bulls continue to have trouble with strong resistance overhead, and this will be the key to putting an end to this violent correction we’ve seen since August. Let’s take a closer look below:
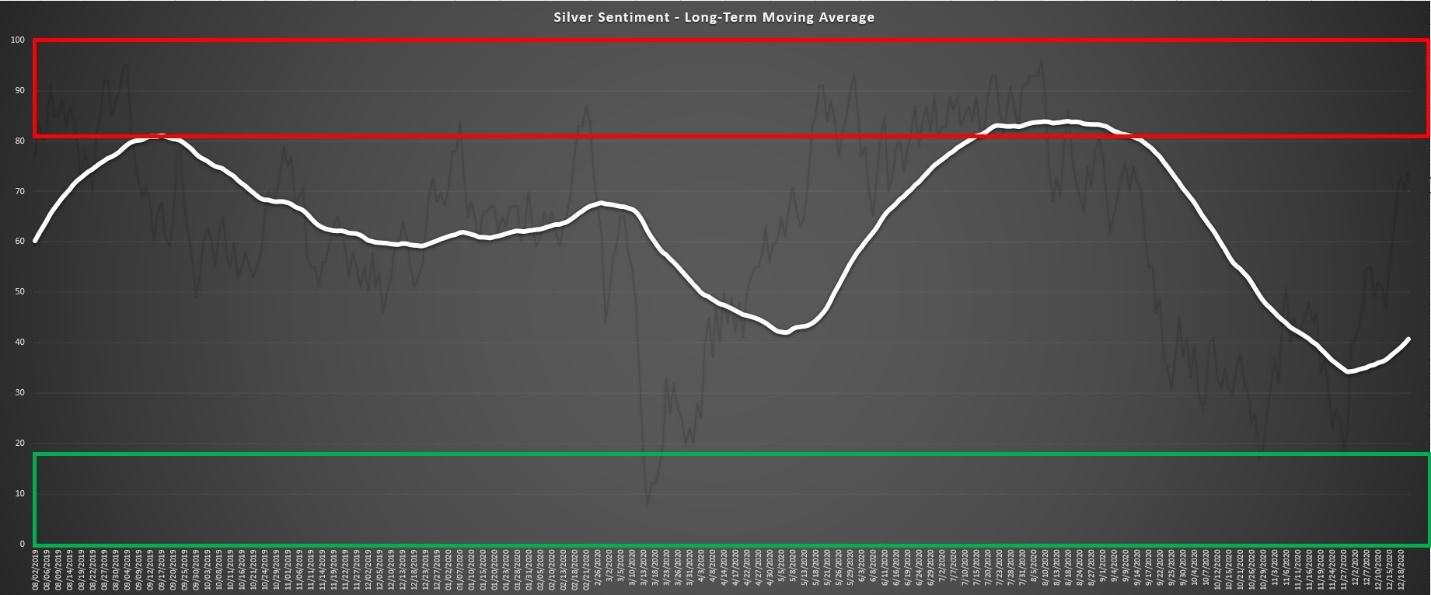
(Source: Daily Sentiment Index Data, Author’s Chart)
As shown in the chart above, we’ve seen a massive sea-change in sentiment over the past few months, with the silver’s long-term moving average for bullish sentiment sliding from 84% bulls to nearly 30% bulls in a matter of just a few months. This sharp decline was due to the mini bear market we saw in the silver market between August and December, with the metal finding itself down 27% from its year-to-date highs at its weakest point of the correction. Fortunately, the bulls managed to play defense exactly where they had to, and sentiment has since recovered quite a bit, ending at 70% bulls last week.
However, while this is a bit of an elevated reading, it’s important to note that long-term sentiment still remains at its lowest levels in over 15 months, suggesting that there’s no zero sign of complacency here in terms of the bigger picture. In fact, as long as this indicator remains below 70% bulls, there’s no reason to believe we’re anywhere near an intermediate top.
(Source: TC2000.com)
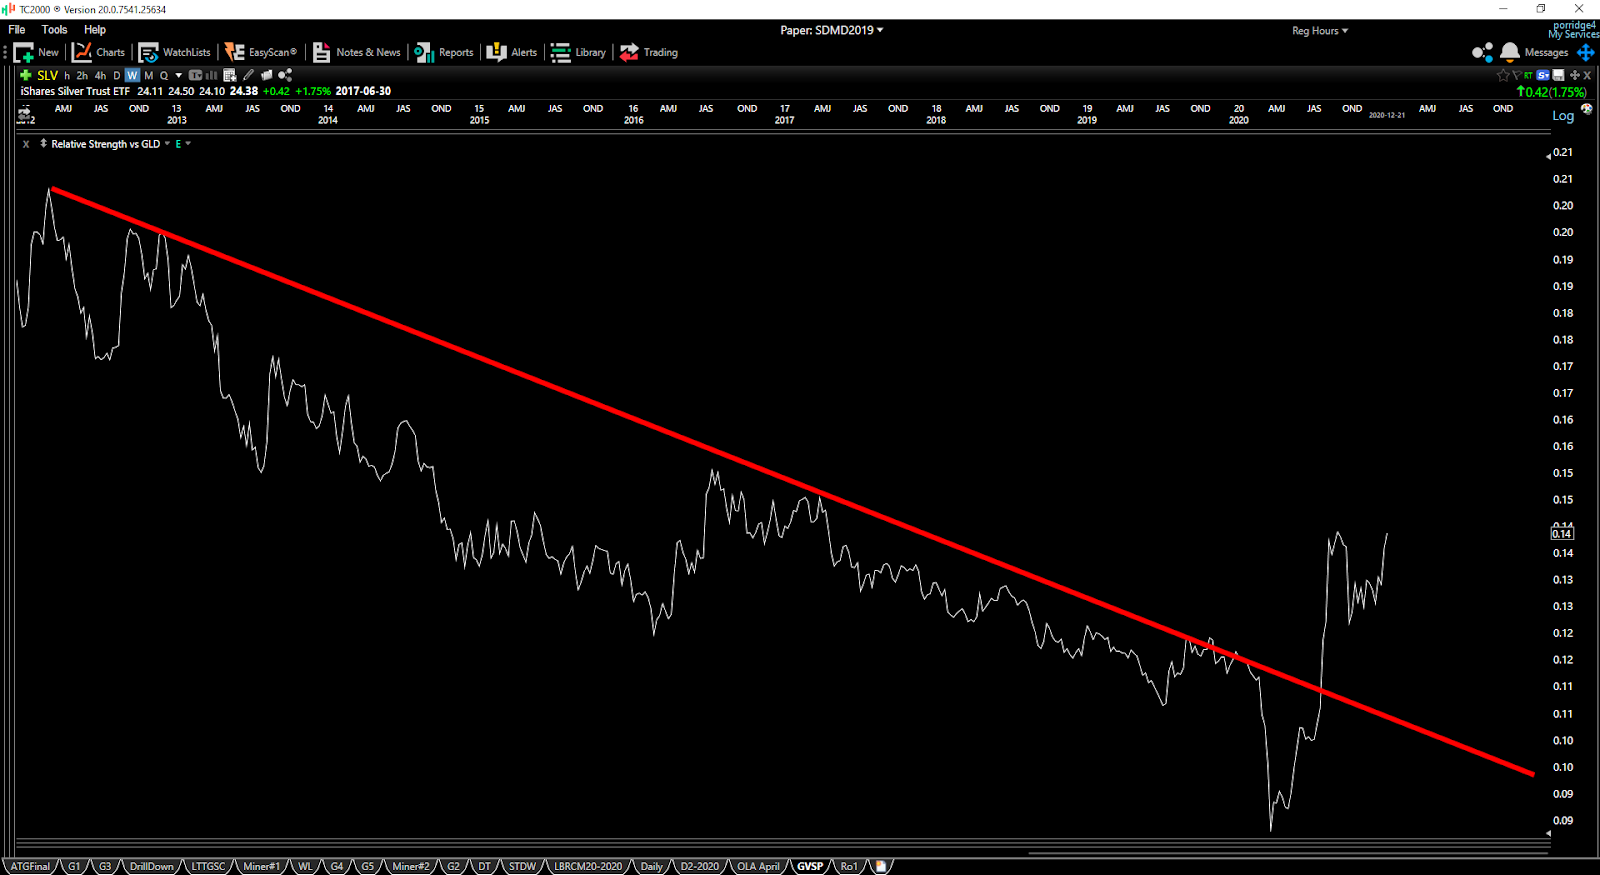
Moving over to the silver/gold ratio, we can see that it broke out of a multi-year downtrend earlier this year and has remained in an uptrend despite its 27% decline from peak to trough. This is a great sign because both metals tend to perform better when silver is the leader. For this reason, this indicator continues to forecast a bullish long-term outlook for the metals complex, and a new high above 0.15 on the ratio would be an even more bullish sign.
(Source: TC2000.com)
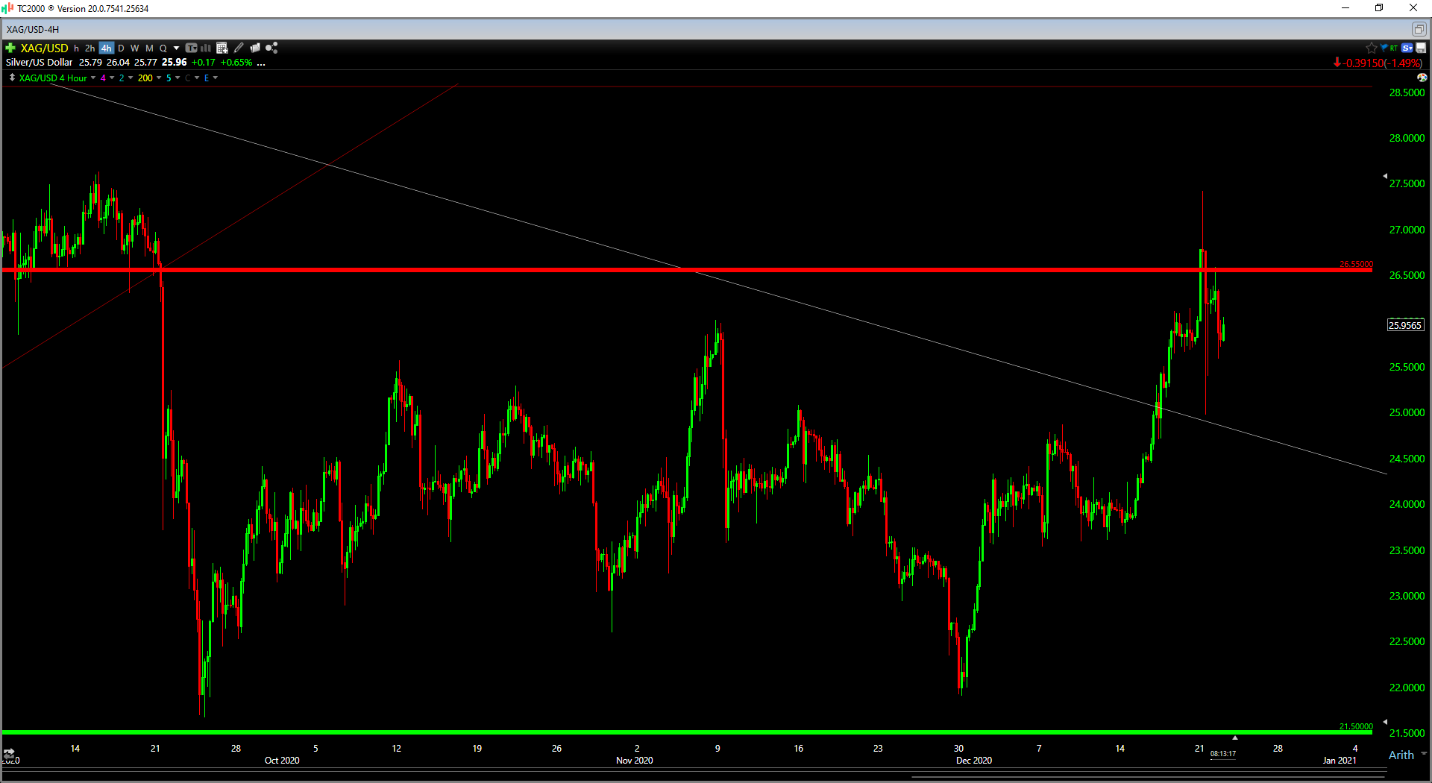
If we move over to the technical picture, though, we do have one hurdle left: the $26.55/oz level for the bulls. As shown above, the bulls continue to have a very tough time with this area, and this was the level where silver initially broke support earlier this year. Until this level is reclaimed on a weekly closing basis, choppy price action and sharp pullbacks to fill out this base are possible.
However, if the bulls can manage to get back above this level, this would target a move above $30.00/oz and new highs next year. It’s important to note that this isn’t a huge deal short-term because silver remains on track for a yearly breakout (shown below), a much more important development for the technical picture. As long as silver can finish the year above $24.00/oz, there’s a good chance that we have a strong year ahead for the metal.
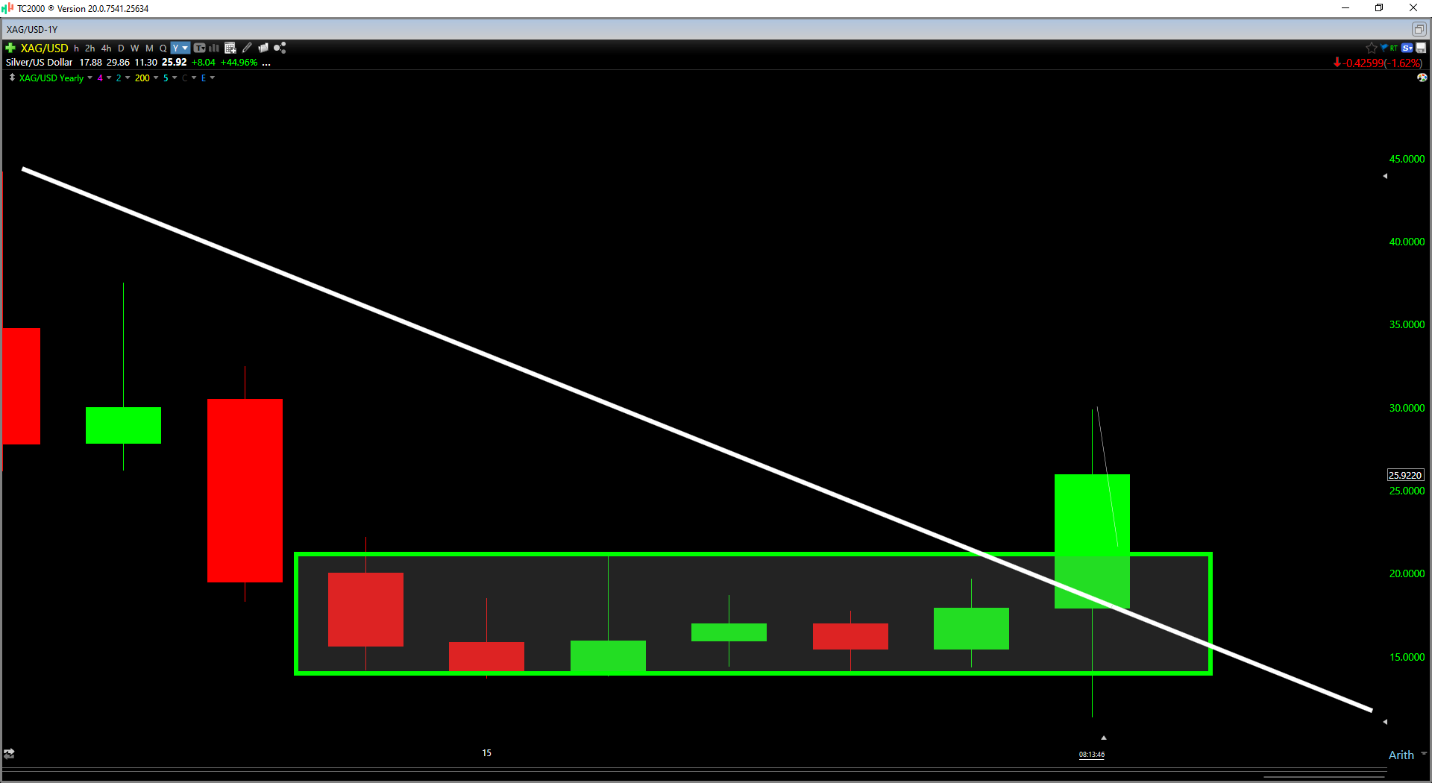
(Source: TC2000.com)
So, what’s the best course of action?
Given that silver remains below its key resistance level, I don’t see a reason to be aggressively near resistance, and the time to start some positions was two weeks ago near support. However, if silver can break out above $26.55/oz on a weekly close, this would significantly increase the probability of new highs. Any 10% pullbacks following that breakout would be buying opportunities. Therefore, I would view any sharp pullbacks to the $24.00/oz level following that breakout to be low-risk buying opportunities. For now, I continue to remain long gold and several gold miners, with my favorite silver miner to buy on dips being Pan American Silver (PAAS).
Disclosure: I am long GLD, NEM, KL
Disclaimer: Taylor Dart is not a Registered Investment Advisor or Financial Planner. This writing is for informational purposes only. It does not constitute an offer to sell, a solicitation to buy, or a recommendation regarding any securities transaction. The information contained in this writing should not be construed as financial or investment advice on any subject matter. Taylor Dart expressly disclaims all liability in respect to actions taken based on any or all of the information on this writing.
Want More Great Investing Ideas?
9 “MUST OWN” Growth Stocks for 2021
Where is the Santa Claus Stock Rally?
5 WINNING Stocks Chart Patterns
SLV shares were trading at $23.98 per share on Tuesday morning, down $0.40 (-1.64%). Year-to-date, SLV has gained 43.76%, versus a 15.88% rise in the benchmark S&P 500 index during the same period.
About the Author: Taylor Dart

Taylor has over a decade of investing experience, with a special focus on the precious metals sector. In addition to working with ETFDailyNews, he is a prominent writer on Seeking Alpha. Learn more about Taylor’s background, along with links to his most recent articles.
The post Silver's Long-Term Picture Remains Bullish appeared first on StockNews.com