
In light of the upcoming holiday season, retail giant Target Corporation (TGT) has unveiled its strategy to employ nearly 100,000 new workers. Starting in October, the company also plans to introduce festive period offers. This move is seen as a preemptive response to anticipated slower growth in U.S. holiday sales this year, caused by economic concerns and rising prices that are predicted to impact consumer spending.
Adding to recent developments, TGT confirmed the imminent shutdown of nine locations across four states, including a branch in East Harlem, New York City, and three in the San Francisco Bay Area. The closures were deemed necessary due to increasing safety hazards linked to theft and organized retail crimes affecting these stores.
Despite facing continual threats from theft-related losses, projected to surpass $1.20 billion in the current fiscal year, CEO Brian Cornell had previously been hesitant to shutter stores. This shift in strategy underscores retailers' trial in minimizing theft while continuing operations in areas where retail options are limited.
Nonetheless, shedding light on brighter terms, TGT boasts a stellar track record of delivering uninterrupted dividend growth for 54 consecutive years. Currently, the corporation pays an annual dividend of $4.40, rendering a yield of 3.29% based on current prices. Over the past three years, its dividend has witnessed a CAGR of 17.8% while recording an 11.7% CAGR over the last five years.
Given the existing scenario, it would be prudent to delve into Target's key financial metrics and trends and wait for a more favorable entry point into the stock.
TGT’s Financial Performance: Analyzing Net Income, P/S Ratio, Current Ratio, and DPS:
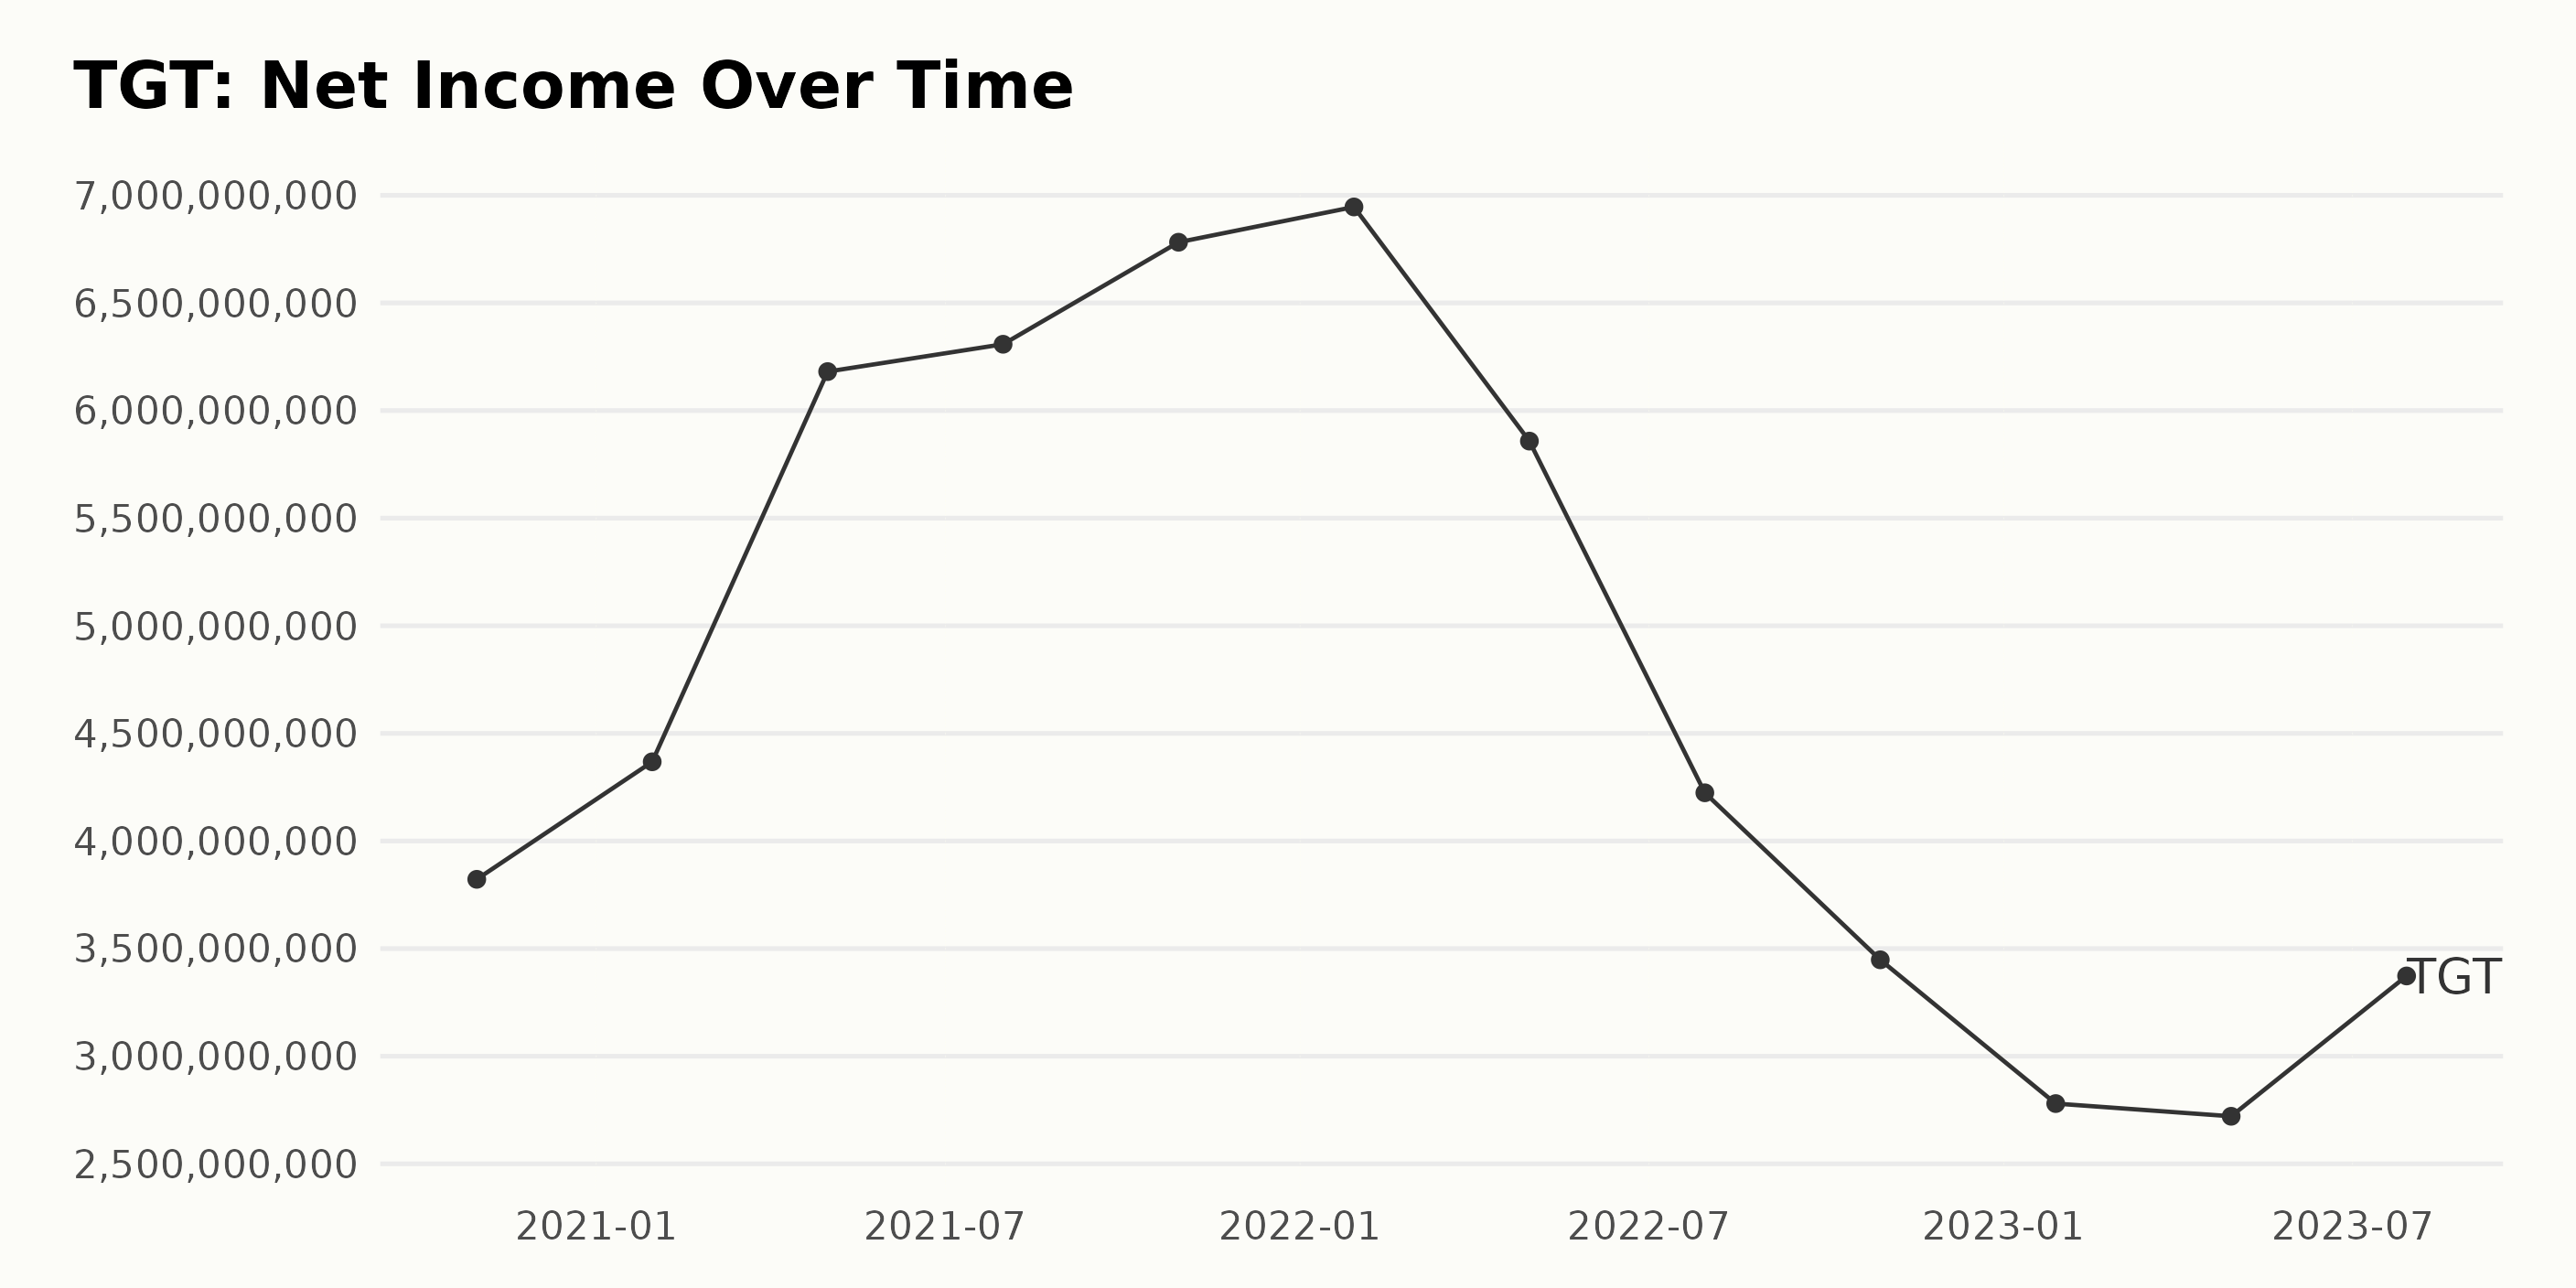
The trend and fluctuations in TGT’s trailing-12-month Net Income from October 2020 to July 2023 show a generally increasing trend, with significant fluctuations over the period. Significant insights of this series are as follows:
- In October 2020, the net income was $3.82 billion. Over the next year, it witnessed a considerable increase, reaching its peak at $6.95 billion in January 2022.
- From January 2022 until October 2022, the net income saw a noteworthy decline, dropping to $3.44 billion. This represents a significant recession compared to the previous highs.
- A low point was reached in April 2023 when the net income contracted to $2.72 billion, showing a notable decrement over one year.
- However, by July 2023, there was a rebound, with the net income slightly recovering to $3.37 billion.
Over the entire duration, the company showed an overall negative growth rate, considering the decrease from the first value ($3.82 billion in October 2020) to the last value ($3.37 billion in July 2023). This suggests that despite certain periods of gain, there were more considerable periods of income contraction impacting the total net income balance of TGT. The more recent data and the last values suggest a recovery trend starting, though the net income remains below past peaks.
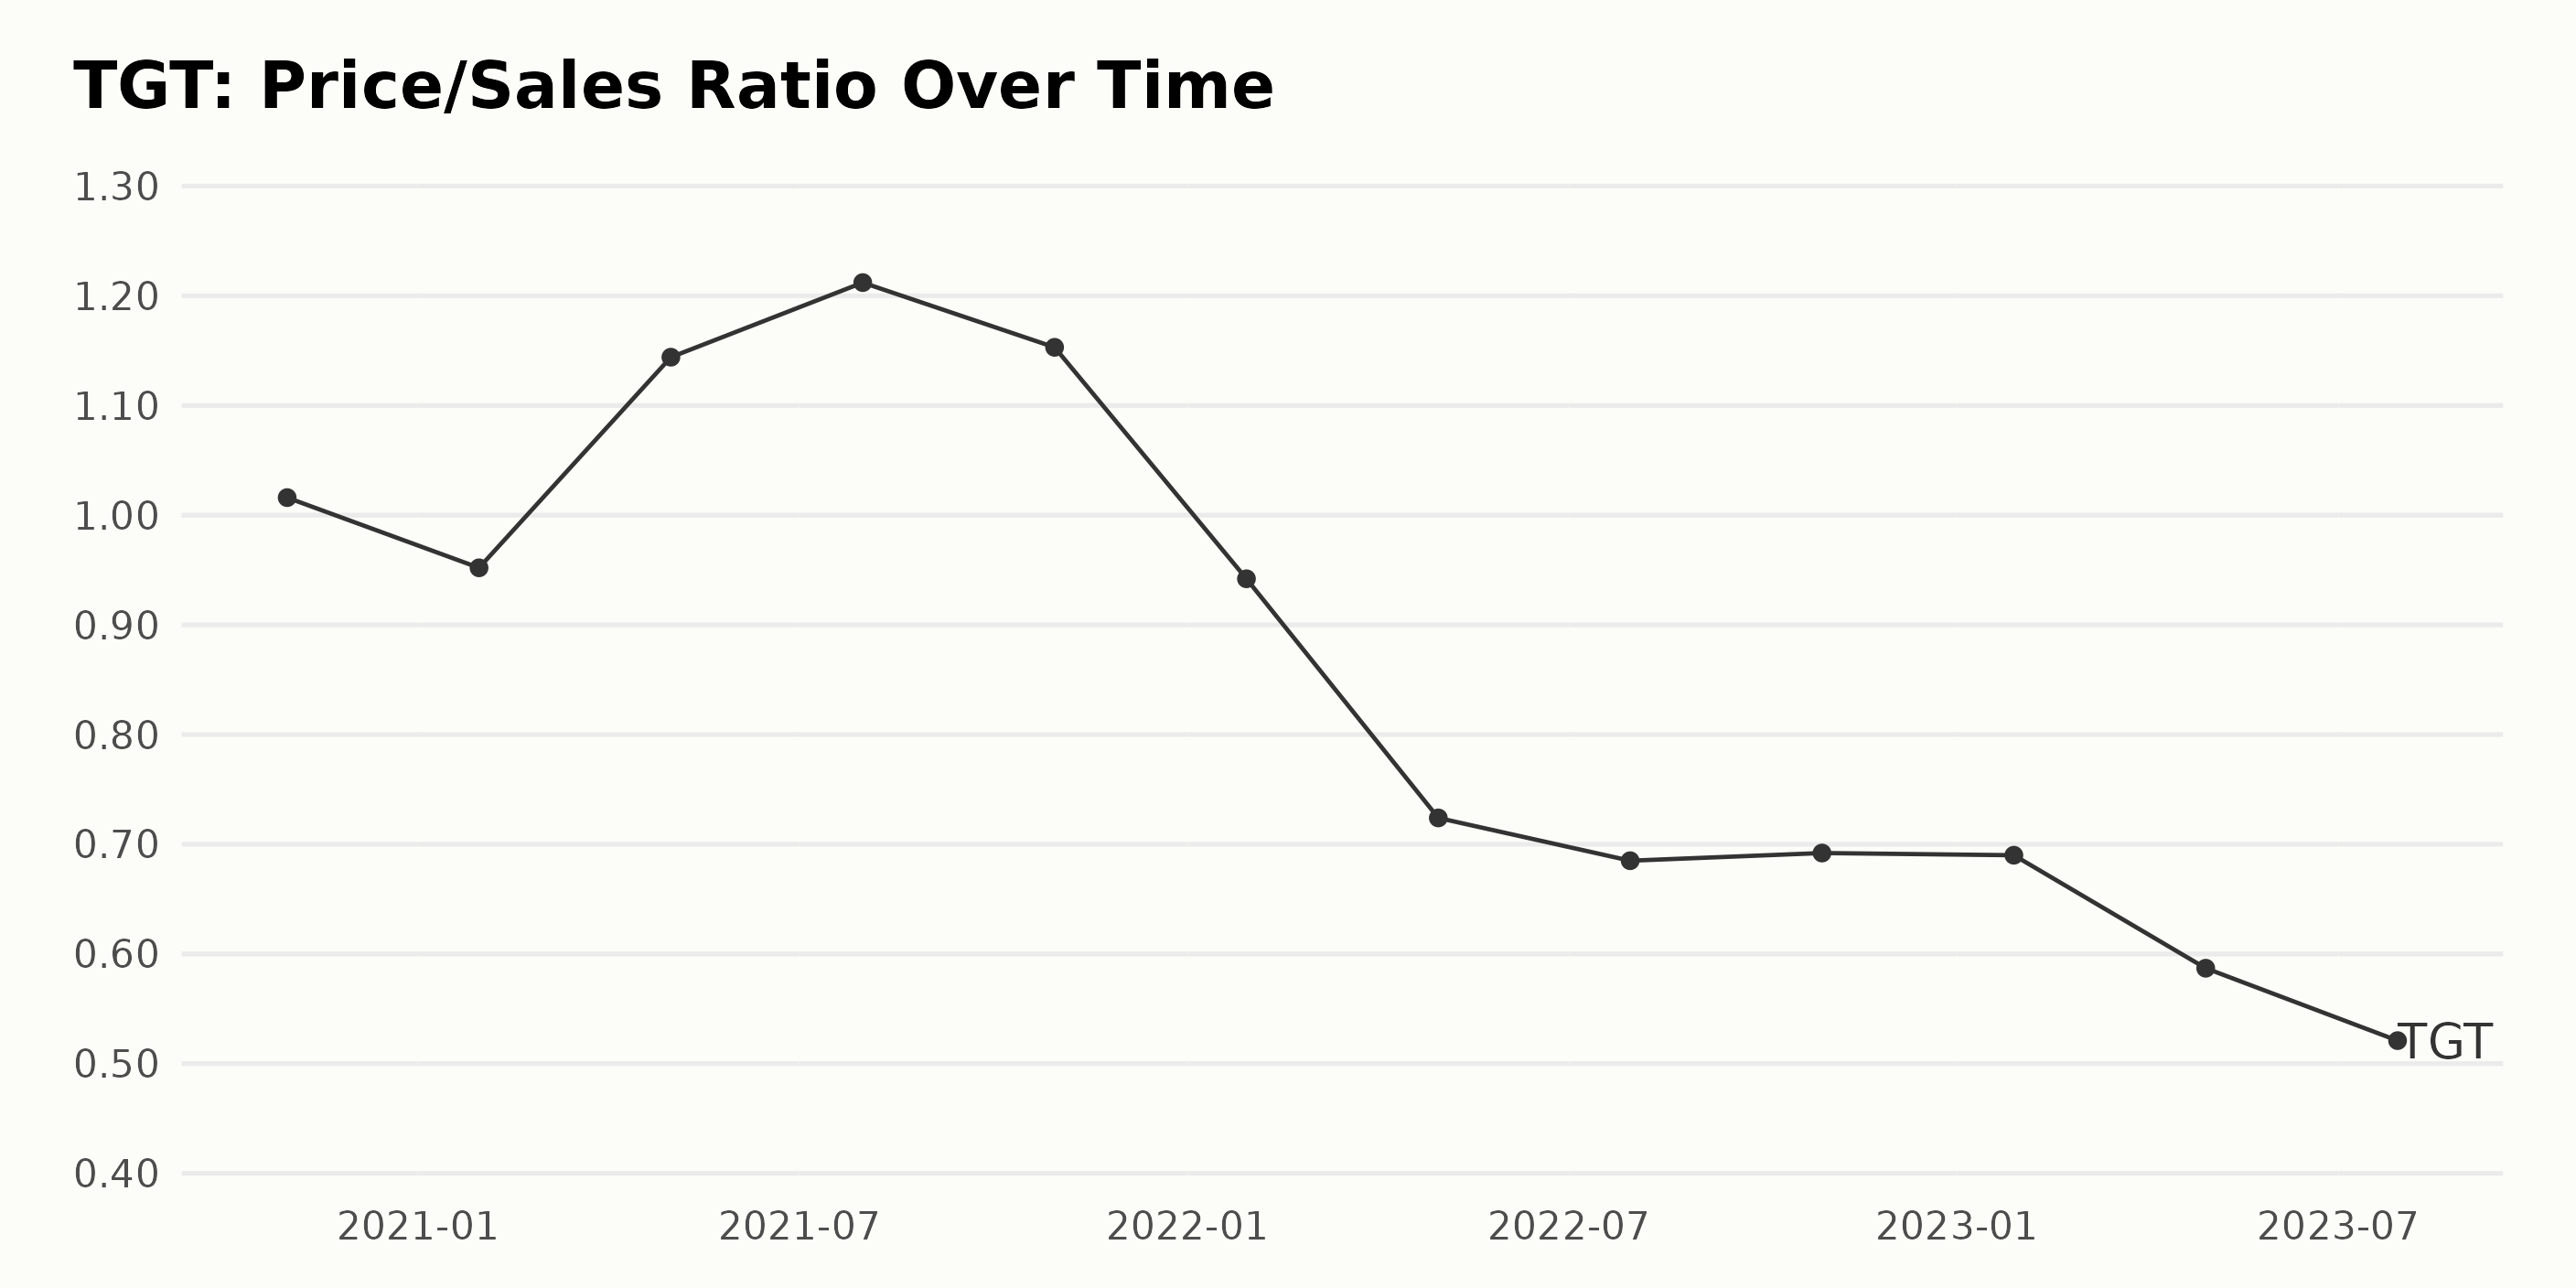
The provided data represents the trend and fluctuations of TGT’s Price/Sales Ratio (P/S), spanning from October 2020 to July 2023. Here are the key Points:
- In October 2020, the P/S ratio of TGT stood at 1.02.
- Subsequently, there was a minor decrease by January 2021 to 0.95, a downtrend of approximately 6.3%.
- A notable hike occurred by May 2021 when the value rose to 1.14, representing a growth rate of around 20%.
- The highest P/S ratio was reported in July 2021, with a value of 1.21, suggesting an increase at about 5.9% from the previous peak.
- In October 2021, a slight drop to 1.15 was observed, which continued to descend more steeply thereafter, reaching 0.69 by January 2023, a significant decline of approximately 40% from the July 2021 high.
- Despite minor fluctuations, a gradual downward trend prevailed from April 2022 onwards, finally arriving at a low of 0.52 in July 2023. This consistent decrease during this period indicates a negative growth rate of approximately 24.6% from the start of this descending phase.
To conclude, critical examination of the numbers reveals an overall downward trend in TGT's P/S ratio, with few momentary rises, specifically during early to mid-2021. The highlights of this review are the persistently diminishing figures experienced towards the recent parts of the series, indicating a relative downfall in the company's P/S. The most recent number in the series - the P/S ratio at 0.52 in July 2023 - shows a substantial reduction of around 48.8% compared to the first value in October 2020.
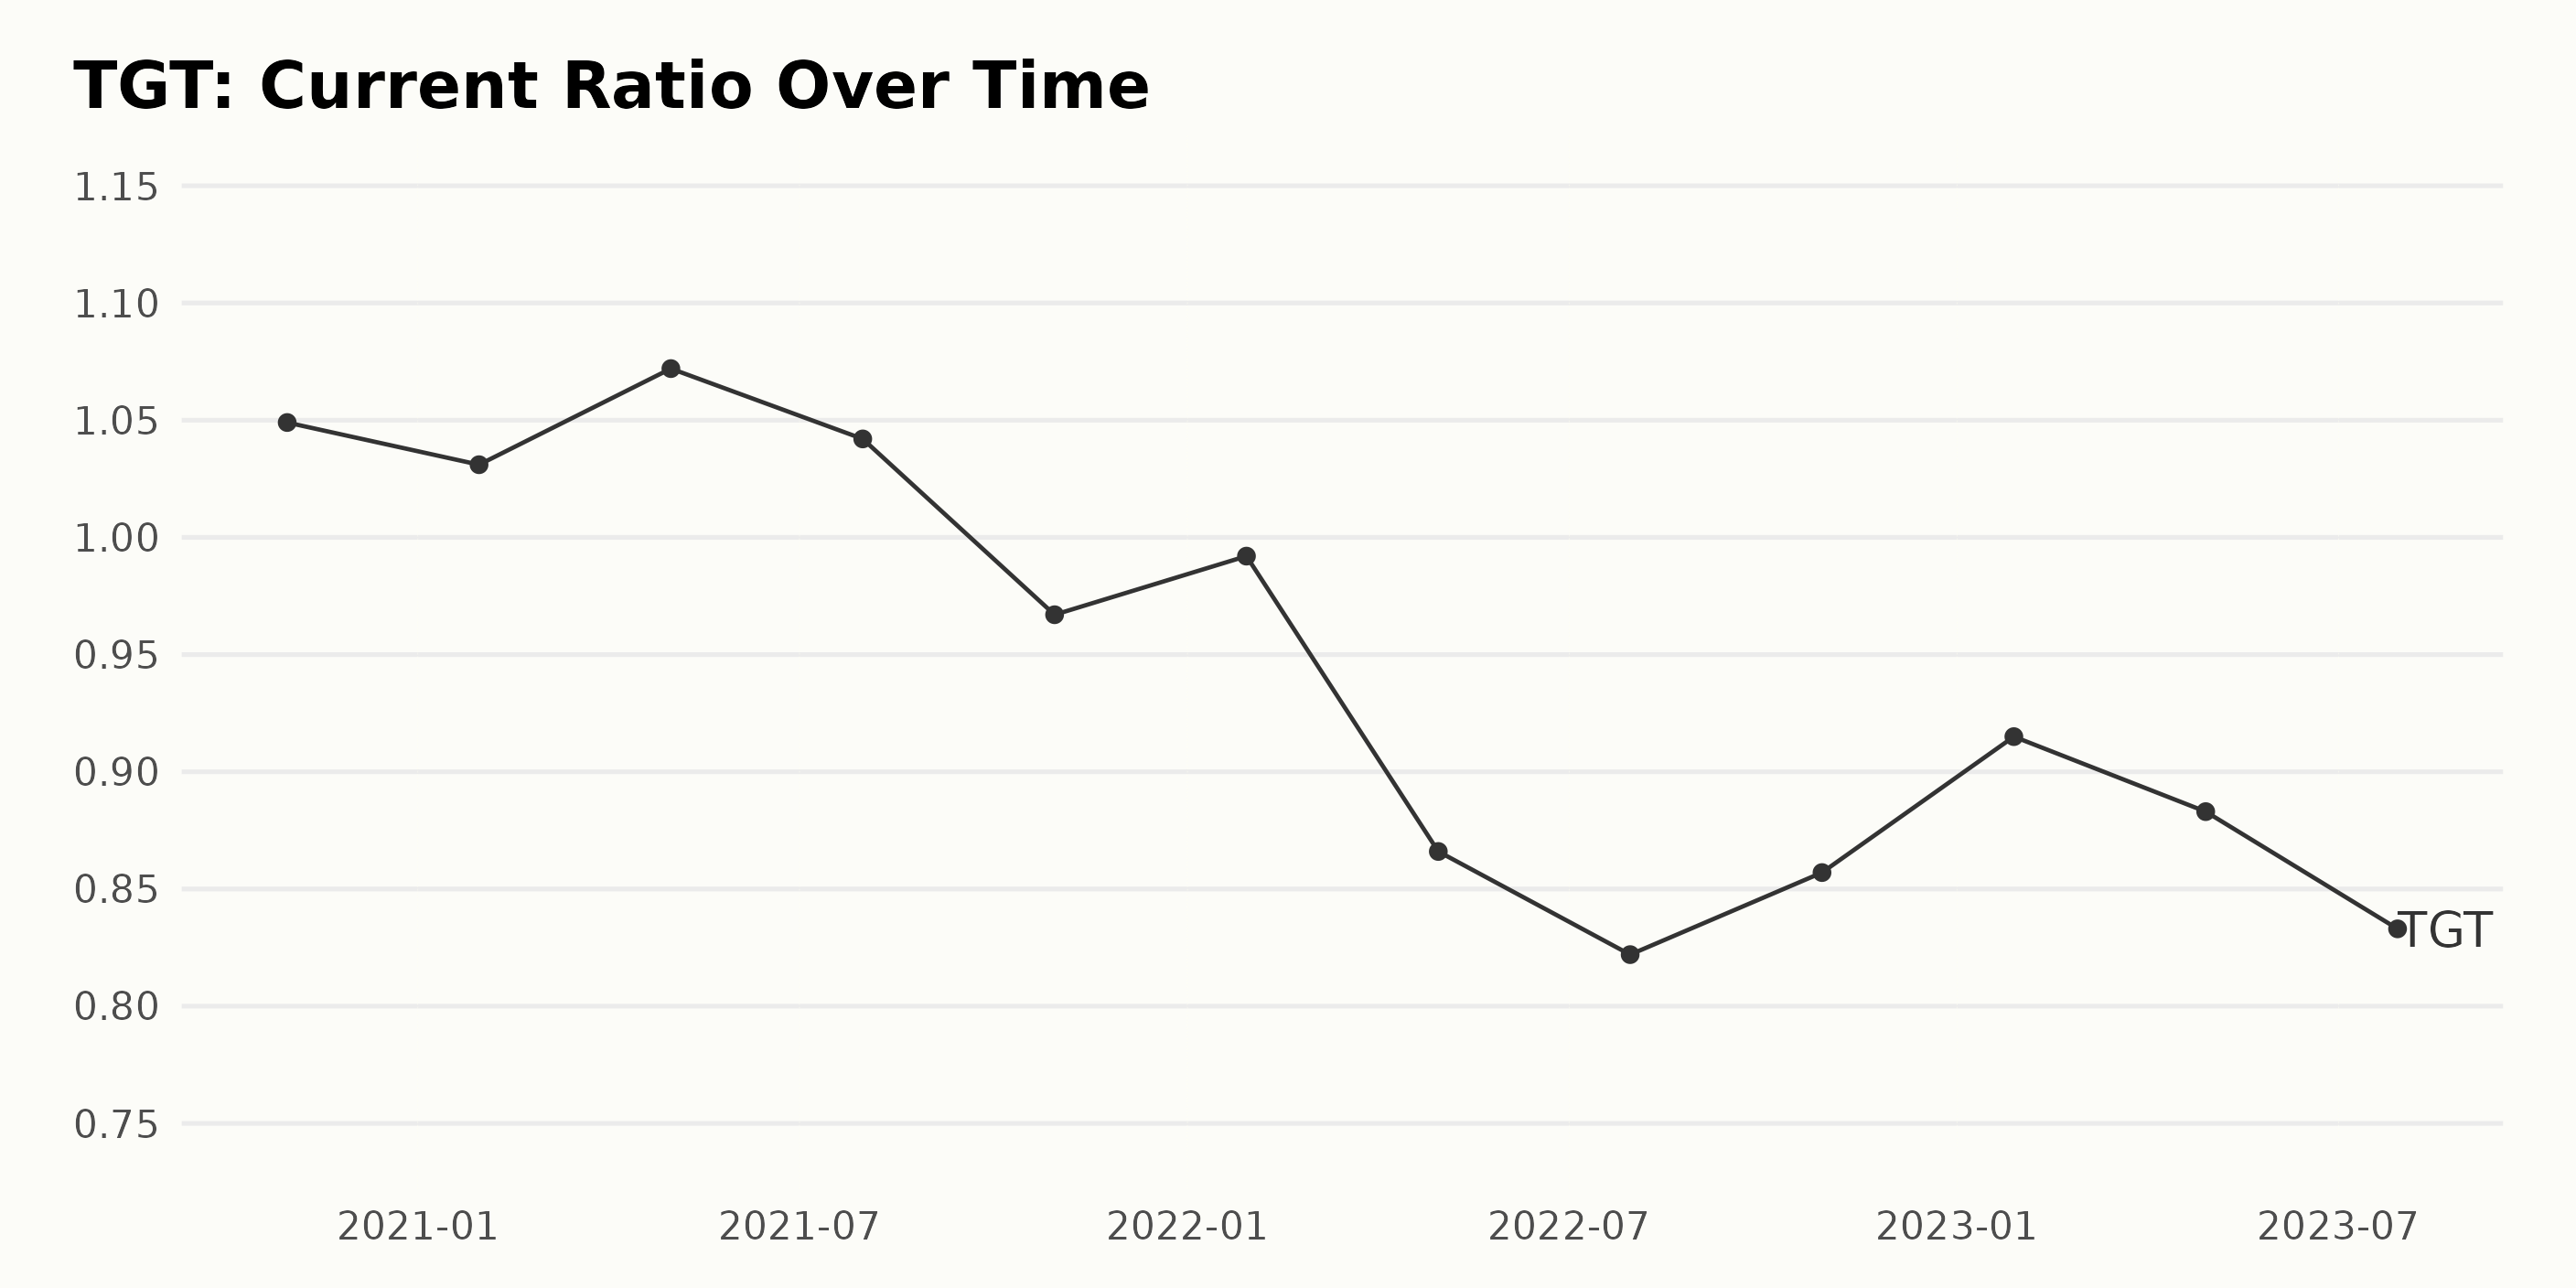
This summary outlines the trend and fluctuations in TGT’s Current Ratio (CR) .
- From October 2020 to July 2023, there has been a general downward trend in the CR.
- The ratio initially decreased slightly from 1.05 in October 2020 to 1.03 in January 2021.
- By May 2021, there was a brief increase to 1.07, followed by a decline to 0.97 in October 2021.
- A slight recovery to 0.99 was seen in January 2022, but the overall descent continued into July 2023 when it reached a low point of 0.83.
Throughout the entire period, noticeable fluctuations were noted without a consistent pattern. The most recent value in July 2023 is 0.833, marking a drop of 20.6% from the first reported value in October 2020. This can be taken as an indication that TGT's liquidity position, based on its CR has weakened over this period.
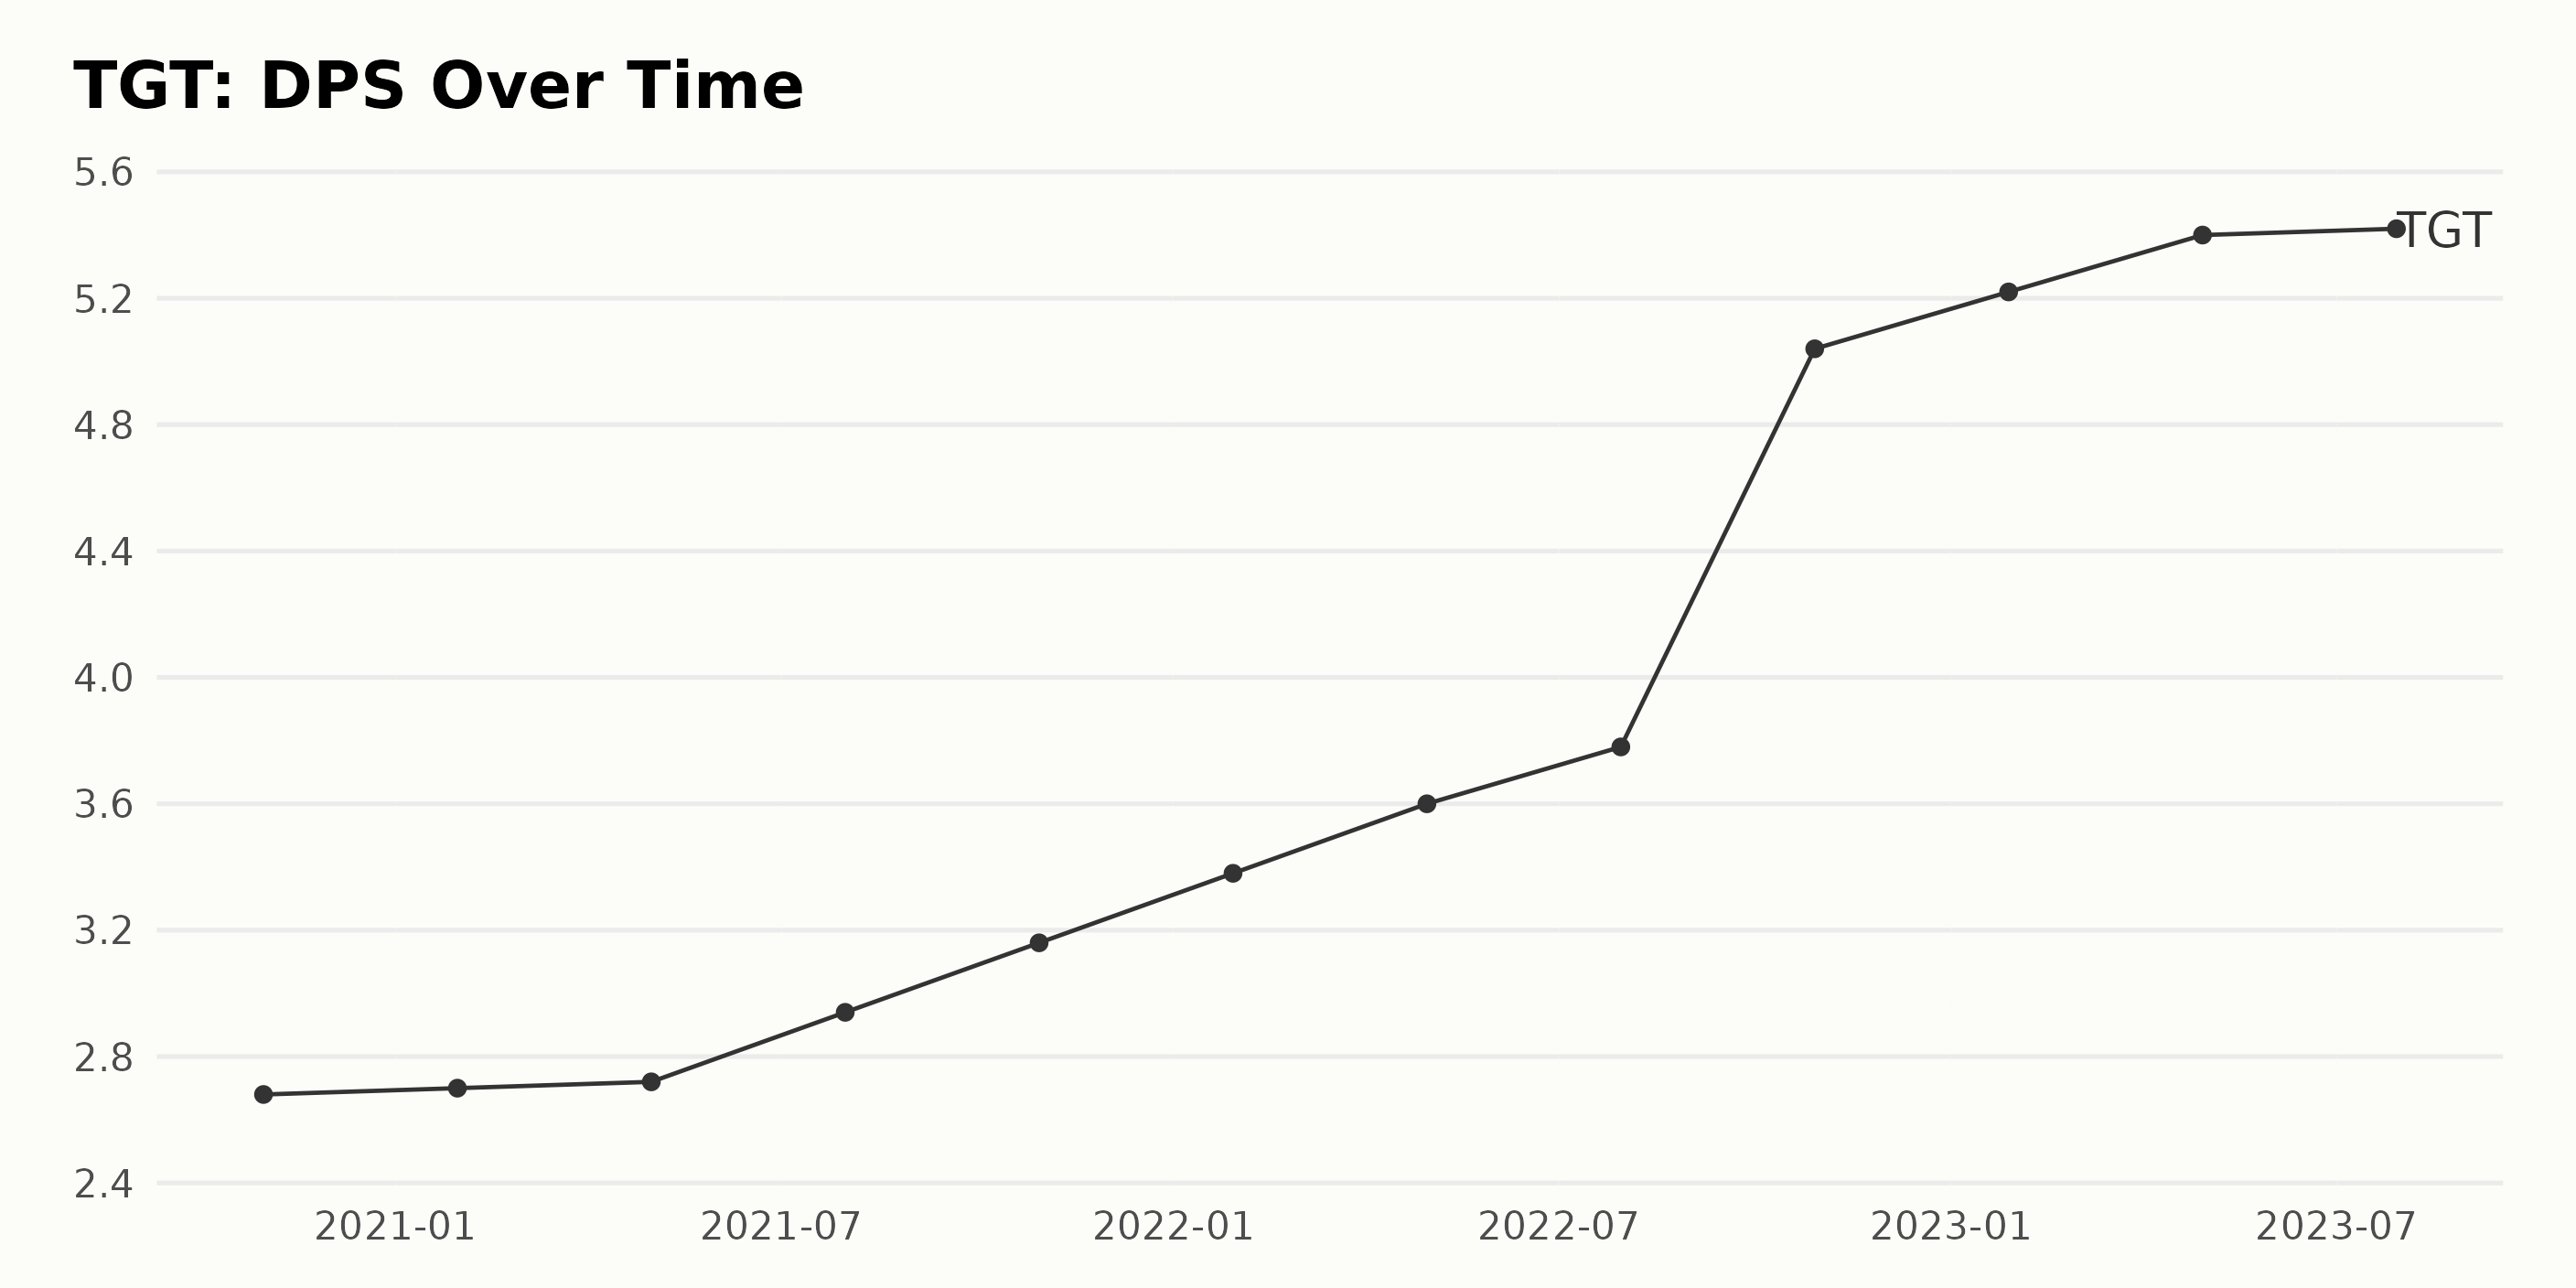
Based on the given data series, TGT’s Dividend Per Share (DPS) showed a consistent upward trend from October 2020 to July 2023. The DPS started at $2.68 in October 2020 and gradually increased over the years, reaching $5.42 by July 2023. Here's a brief summary of the key points:
- In late 2020 and throughout 2021, there were slight increments in the DPS. The DPS rose from $2.68 in October 2020 to $2.7 in January 2021, followed by a slight increment to $2.72 in May 2021. By the end of 2021, the DPS grew to $3.16.
- In 2022, a continuous growth pattern was observed, with the DPS reaching $3.6 in April, $3.78 in July, and showing a significant jump to $5.04 in October.
- In 2023, the increase in DPS decelerated a bit. The value rose to $5.22 in January and reached $5.4 in April. The last reading in July indicates a minimal rise to $5.42, signaling a slowdown in DPS growth.
The overall growth rate, calculated by measuring the final value from the first, signifies an increase by approximately 102.2% over the period under review. The emphasis on the more recent data shows a potentially decreasing growth rate, which is visible from the relatively small increase in DPS in the last quarters of 2023 compared to previous years.
Analyzing the Downward Trend in TGT's Share Prices, April-September 2023
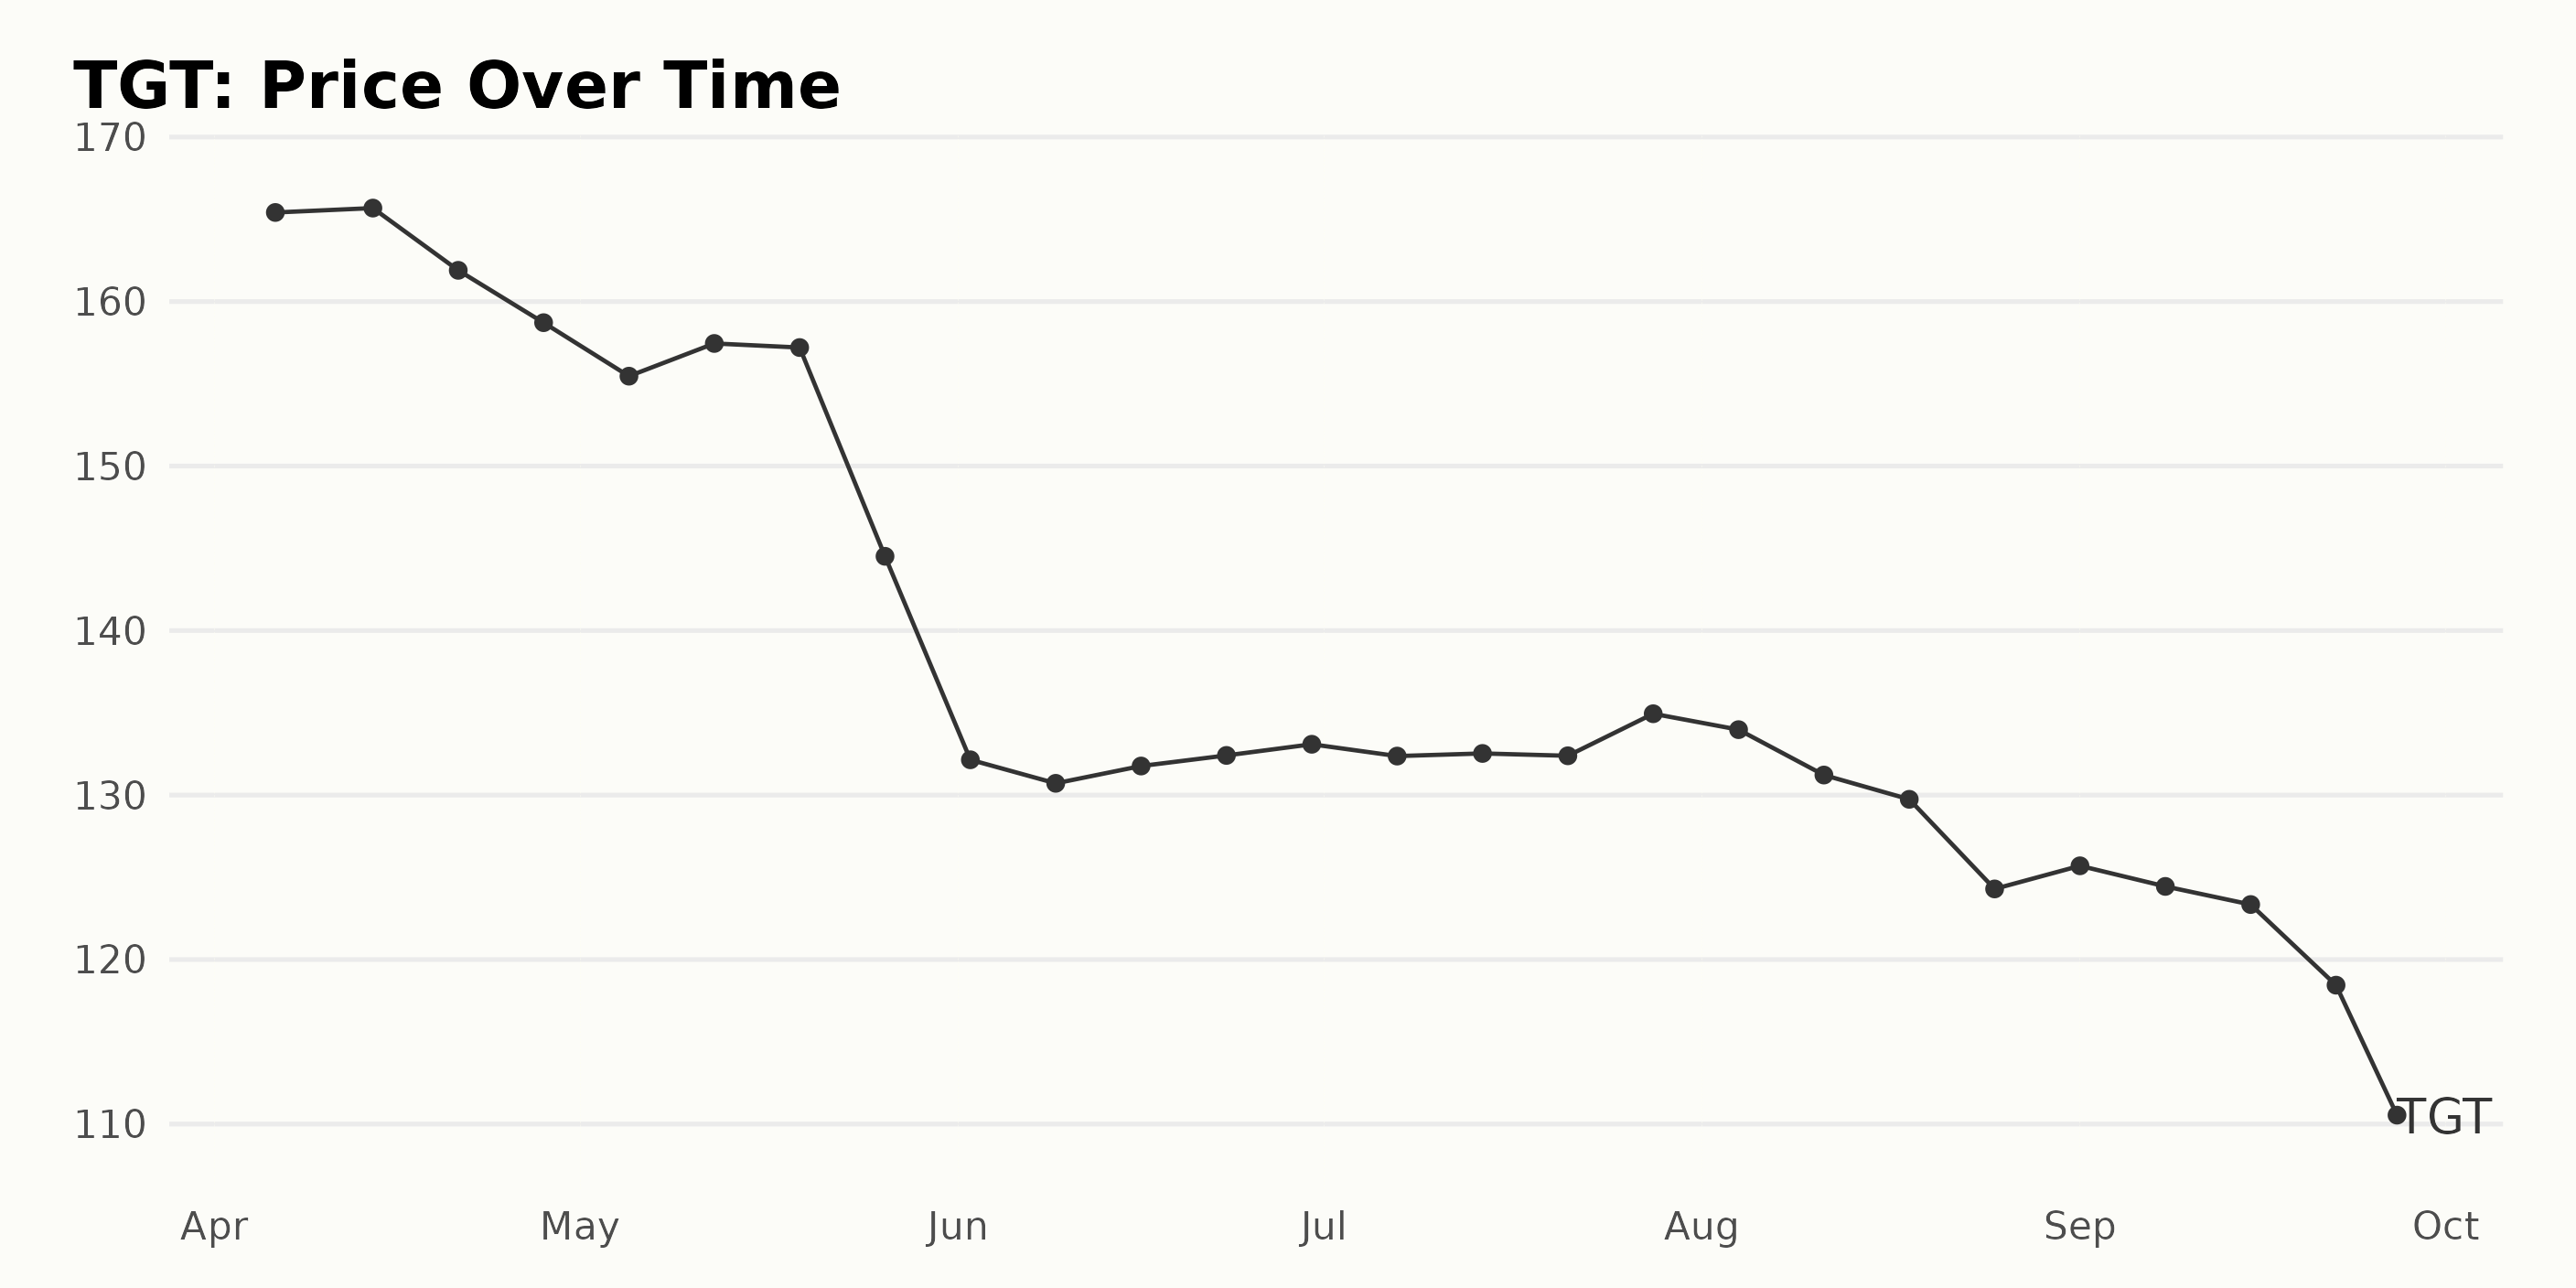
The share price data of TGT from April to September 2023 reveals an overall declining trend. The prices are rounded to significant 2 digits and the growth rate presented is approximate.
- Beginning on April 6, 2023, with a personal share price at $165.42, TGT experienced a marginal increase to $165.68 by April 14, 2023.
- However, this uptick was followed by a downward trend through the end of April and into May, falling to $155.46 by May 5, 2023.
- A brief upward spike occurred mid-May, reaching $157.45 on May 12, 2023, before decreasing slightly to $157.20 by May 19, 2023.
- The share prices then fell significantly to touch $144.51 at the end of May and continued to decline sharply, reaching $132.15 in early June 2023.
- June and July showed slight fluctuations but remained relatively stable around the $130-134 range.
- A more noticeable downward trend began again in August, descending from $133.98 at the beginning of the month to $124.29 by the end of August.
- The declining rate slowed down a bit in September, oscillating around the $123-125 range for the first half of the month and falling to $110.54 by the end of this period (September 27, 2023).
From these data points, there seems to be a clear and accelerating downward trend in TGT’s share prices from April to September 2023. The prices seem to stabilize to some extent in June and July 2023, reflected in less drastic price changes during these months. However, the declining trend picks back up speed in August and continues into September. The overall decrease in share prices could be indicative of various market factors impacting TGT's valuation during this time period. Here is a chart of TGT's price over the past 180 days:
Analyzing TGT's POWR Ratings in 2023
TGT has shown varied performance throughout the year according to its POWR Ratings, an indicator of its relative appeal to investors. The stock’s performance over time is detailed below:
- From April to May 2023, TGT retained a consistent C POWR Ratings, and its rank fluctuated slightly from 29 to 31 out of 39.
- In early June 2023, the POWR Ratings improved to B. Its rank also achieved a superior placement at 25 for the week of June 3.
- This was followed by a mixed performance until mid-July, with the POWR Ratings shifting between B and C. Notably, the rank remained relatively stable during this period.
- The week of July 15 saw a dip to a C POWR Ratings, but it quickly rebounded to B by the end of the month.
- TGT experienced varying performance again in August, transitioning from C to B, then back to C by August 26. Its ranking relative to other stocks in the category echoed these fluctuations.
- September proved to be a relatively strong month for TGT, with the stock achieving a B POWR Ratings for two weeks. However, the grade dipped down to C by the end of September.
As of the latest provided data point, on September 27, 2023, TGT holds a C POWR Rating and is ranked #27 out of 39 stocks in the Grocery/Big Box Retailers industry.
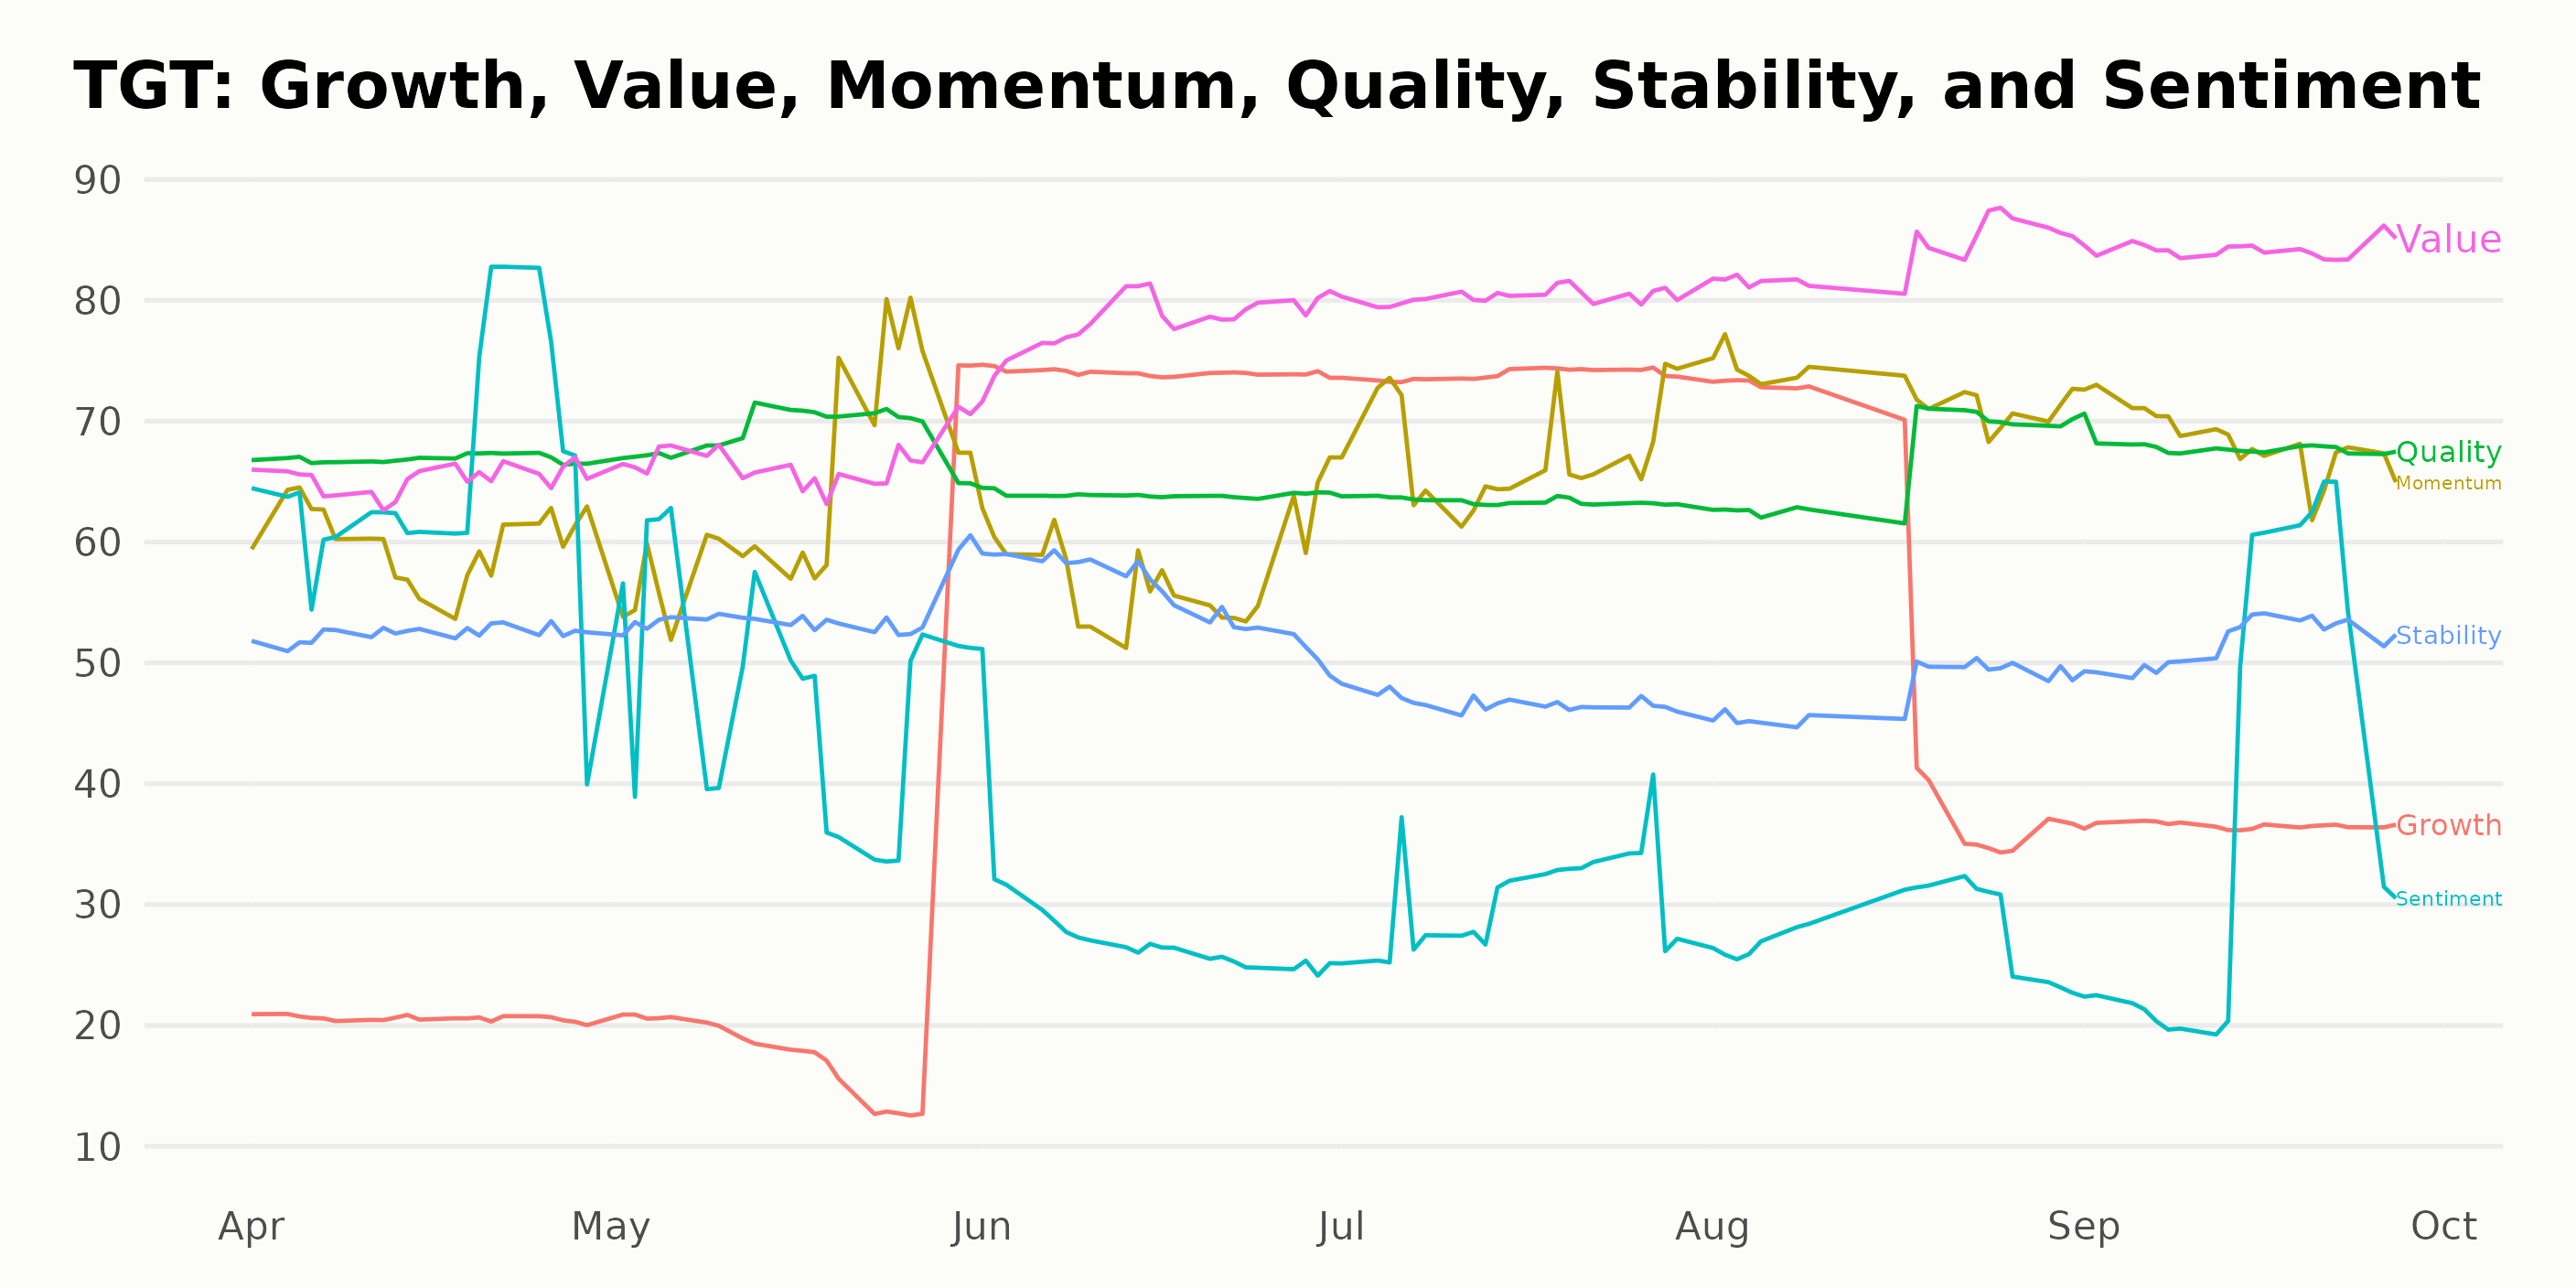
Based on the POWR Ratings data provided, the three crucial dimensions with noteworthy information for Target Corporation (TGT) are Growth, Value, and Momentum. These ratings represent how TGT performs in these different aspects.
Growth:
The Growth rating for TGT observes a significant uptrend in June and July of 2023, reaching a value of 74, followed by a decline to 37 by September 2023.
Value:
The Value dimension for TGT shows a consistent upward trend from April to September 2023, reaching and maintaining a peak value of 84 in August and September.
Momentum:
The Momentum rating exhibits slight fluctuations over time but overall maintains a fairly high value. The highest values are achieved in August and September 2023, with ratings of 73 and 68, respectively, indicating a strong momentum in the latter half of the year.
How does Target Corporation (TGT) Stack Up Against its Peers?
Other stocks in the Grocery/Big Box Retailers sector that may be worth considering are Natural Grocers by Vitamin Cottage Inc. (NGVC), Village Super Market Inc. Common Stock (VLGEA), and Walmart Inc. (WMT) -- they have better POWR Ratings. For exploring more A and B-rated Grocery/Big Box Retailers stocks, click here.
What To Do Next?
Get your hands on this special report with 3 low priced companies with tremendous upside potential even in today’s volatile markets:
3 Stocks to DOUBLE This Year >
TGT shares were trading at $109.59 per share on Thursday morning, down $0.15 (-0.14%). Year-to-date, TGT has declined -24.87%, versus a 13.36% rise in the benchmark S&P 500 index during the same period.
About the Author: Kritika Sarmah

Her interest in risky instruments and passion for writing made Kritika an analyst and financial journalist. She earned her bachelor's degree in commerce and is currently pursuing the CFA program. With her fundamental approach, she aims to help investors identify untapped investment opportunities.
The post Target (TGT): October Buy or Sell? appeared first on StockNews.com