
GameStop Corp. (GME), which was previously in the spotlight during the meme stock frenzy, has recently appointed renowned activist investor, Ryan Cohen, as Chief Executive Officer. A sterling name in the industry, Cohen is recognized for his keynote investments in a slew of firms, one of which was the now-bankrupt Bed Bath & Beyond.
Shortly after his appointment, he announced plans to revitalize GME's struggling business model. Notwithstanding the brief surge during the meme stock phenomenon, GME’s shares have substantially depreciated. Witnessing a steady downtrend, the final trading figure signified a downtrend, closing the last trading session at $14.60, lower than its 50-day moving average of $18.70 and the 200-day moving average of $20.63.
The soundness of GME's profits remains a topic of concern. Its trailing 12-month gross profit margin stands at 23.82%, significantly below the industry average of 35.41%. Its trailing-12-month gross profit margin of 23.82% is 32.7% lower than the industry average of 35.41%. Its trailing-12-month ROCE, ROTC, and ROTA of negative 7.65%, 4.91%, and 3.56% compare to the industry averages of 11.39%, 6.08%, and 3.85%, respectively.
Considering this context, scrutiny of GME’s key financial indicators can provide insight into why it may be prudent to refrain from investing in the stock at present.
Examining GameStop's Financial Performance and Market Trends (2021-2023)
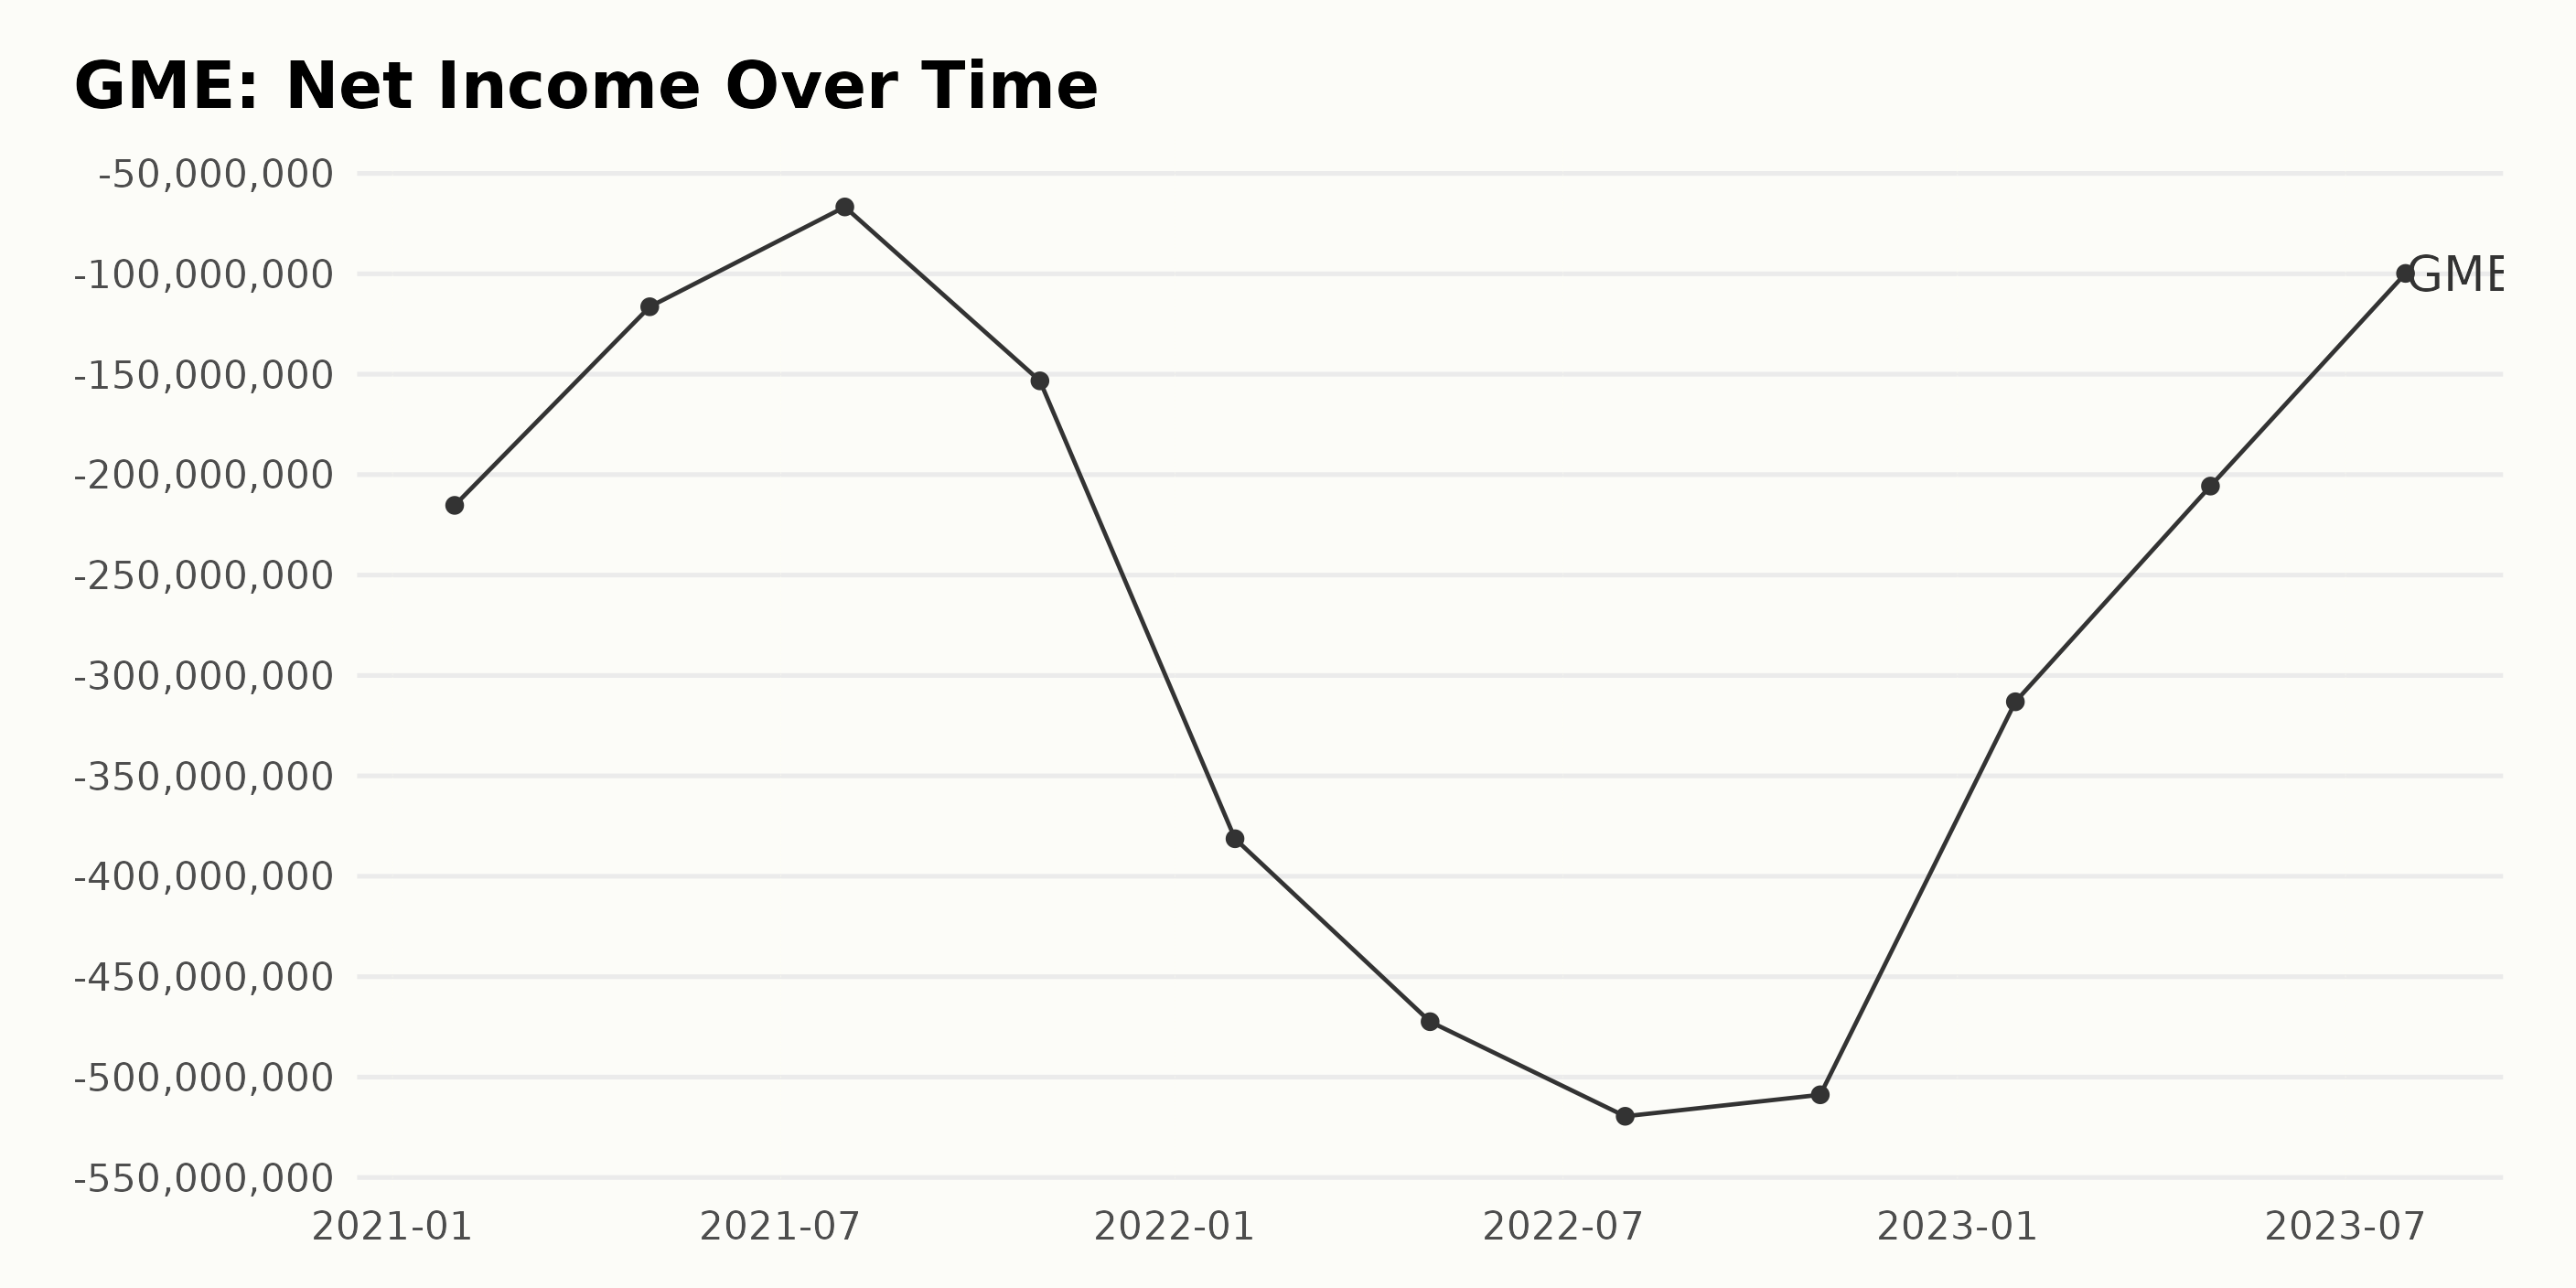
GME has experienced a significant fluctuation in its trailing-12-month net income from January 2021 to July 2023. Here are the net income highlights over that period:
- January 2021: -$215.3 million
- May 2021: -$116.4 million
- July 2021: -$66.7 million
- October 2021: -$153.3 million
- January 2022: -$381.3 million
- April 2022: -$472.4 million
- July 2022: -$519.5 million
- October 2022: -$508.8 million
- January 2023: -$313.1 million
- April 2023: -$205.7 million
- July 2023: -$99.8 million
Overall, the company's net income has demonstrated a downward trend from a loss of $215.3 million in January 2021 to a more substantial loss of $519.5 million by July 2022, marking a steep growth rate in losses during this period.
However, from October 2022, there was a slight but noticeable improvement as the losses lessened gradually, reaching -$205.7 million by April 2023. By the last recorded date in July 2023, the net loss was at its lowest since 2021, standing at -$99.8 million, pointing to an optimistic upturn in the company's financial position. The fluctuation indicates possible efforts to navigate the company's financial situation.
The gross margin of GME over the recent years has typically fluctuated between 21.0% and 24.7%.
- On January 30, 2021, the gross margin was at its maximum value of 24.7%.
- The gross margin then slightly declined to 24.5% by May 1, 2021, and sustained a nearly similar percentage at 24.6% as of July 31, 2021.
- By October 30, 2021, the margin slipped down to 24.1% and continued to drop sharply, reaching 22.4% by January 29, 2022.
- Simultaneously, April 30, 2022, witnessed another drop to 21.5%, with minor but consistent decreases through July 30, 2022, and October 29, 2022, at 21.1% and 21.0%, respectively.
- However, in a turn of events, GME's gross margin started picking up from January 28, 2023, hitting 23.1%.
- It continued this ascendant trajectory, registering 23.5% on April 29, 2023, and reaching 23.8% on July 29, 2023. This is the last recorded value.
Overall, the gross margin depicts a downward trend from its peak in early 2021 to late 2022, followed by a rebound starting from early 2023 onwards. It declined by a significant 3.9 percentage points from January 2021 to October 2022 before bouncing back with an increase of 2.8 percentage points from October 2022 to July 2023.
In terms of growth rate, comparing the first data entry (24.7%) with the last (23.8%), there has been a marginal decrease of 0.9 percentage points over this period.

Based on the series of data, GME's asset turnover has experienced fluctuations over time, with a general downward trend from January 2021 to April 2022 before recovering relatively more recently. Here are key points to note about the data:
- In January 2021, GME's asset turnover was approximately 2.05.
- It rose to a high of 2.14 in May 2021.
- Since then, the asset turnover started to fall, reaching a low of 1.76 in April 2022.
- However, from April 2022 to July 2023, a fluctuating but general upward trend can be observed, with the asset turnover improving to nearly 1.89 by July 2023.
Calculating the growth rate from the first value in January 2021 (2.053) to the last value in July 2023 (1.889), there is a decrease of around 8%. This indicates a significant slowdown in the company’s ability to generate sales from its assets over this period.
Despite the overall drop, the recent upward trend suggests a potentially improving situation for GME's asset efficiency. Note: It is critical to consider other factors, such as company strategy, market conditions, and sector averages, when making conclusions based on asset turnover.

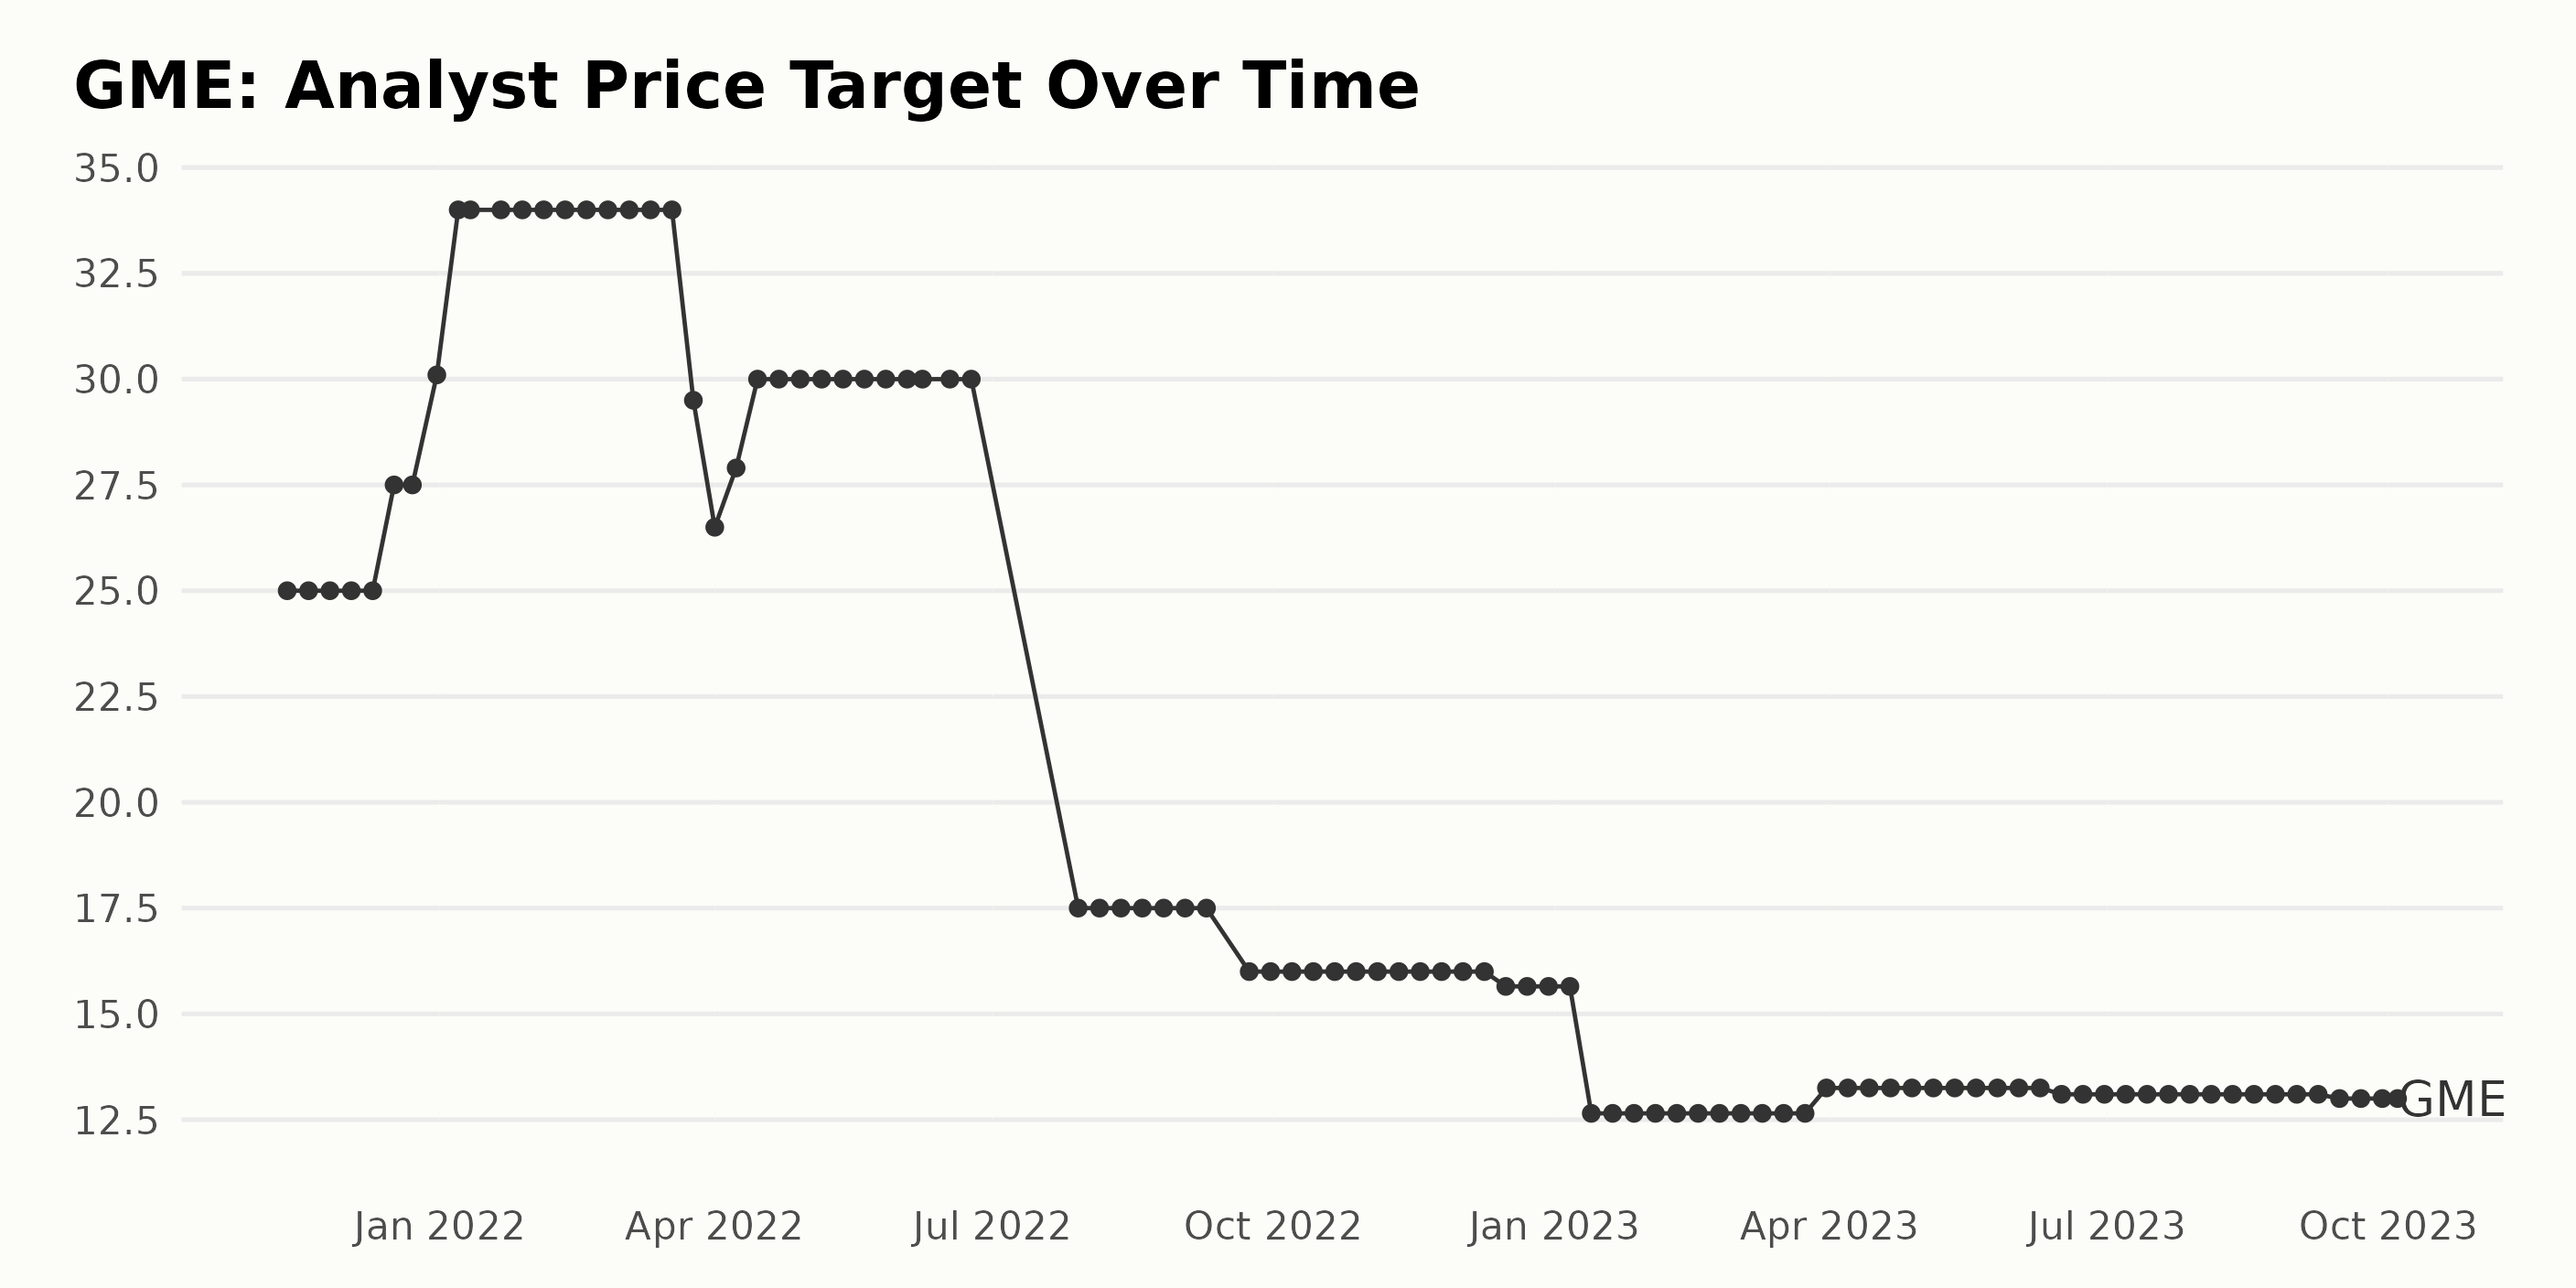
The Analyst Price Target (APT) for GME observed significant fluctuations over the recorded time period starting from November 2021 to October 2023.
- The APT commenced at $25 in November 2021, maintaining consistency until the start of December 2021.
- From December 2021, an upward trend was noticed, reaching a peak of $34 by January 2022, which then remained constant till March 2022.
- A swift drop to $29.5 was seen in late March, and this figure fell slightly further to $26.5 in early April. However, the APT recovered up to $30 by mid-April and maintained this level until the end of June 2022.
- A sharp decrease was again noticed in July when it dropped to $17.5. After modest fluctuation, it further decreased to $16 by September 2022 and continued at this rate till mid-December.
- From late December 2022 to January 2023, there was another noticeable decline as APT fell to $12.65.
- At the end of March 2023, it slightly increased to $13.25.
- By mid-June 2023, the APT saw a minor drop to $13.1. This trend continued until it reached $13 by mid-September 2023.
- Finally, the APT ended at $13 by the data series conclusion in October 2023.
The growth rate from the beginning to the end of the period represents a decrease of 48%. The fluctuation and downward trend in later data demonstrate a negative view from analysts regarding GME's stock price.
However, periods like January 2022, where the stock price plateaued at a higher rate, demonstrate times of more bullish sentiment. The cause of these shifts could be numerous, from changes in the company's financial health to broader market trends affecting the retail industry and investor sentiments.
Analyzing the Fluctuating Trend of GameStop's Share Price: April-October 2023
The data presents a fluctuating trend in the share price of GME from April 2023 to October 2023. Here's a descriptive rundown:
- On April 14, 2023, the share price of GME was $22.58.
- There is a decreasing trend through the month of April 2023, ending with a price of $19.31 on April 28, 2023.
- A gradual increase appeared in the share prices throughout May 2023, and it reached $23.32 on May 26, 2023.
- In June 2023, the share prices continued to fluctuate, hitting a peak of $25.26 on June 16, 2023, but ending the month slightly less at $24.14 on June 30, 2023.
- July 2023 saw a gentle decrease from $23.74 on July 7, 2023, to $22.61 on July 28, 2023.
- However, there was an accelerating depreciation in August 2023, with the share price dropping down to $17.30 on August 25, 2023.
- Amidst fluctuations, September 2023 concluded with little change, settling at $17.10 on September 29, 2023.
- Finally, a sharp decrease was noticed by the beginning of October 2023, and as of October 3, 2023, the share price dropped to $14.60.
In conclusion, notwithstanding the intermittent waves of increase through May and June, the overall trend in the share price of GME from April 2023 to October 2023 was a decelerating one.
Here is a chart of GME's price over the past 180 days.

Analyzing GameStop's Fluctuating Ratings in Growth, Momentum, and Quality over 2023
The POWR Ratings grade of GME has shown fluctuations for the period from April to October 2023. The following points provide a more detailed breakdown:
- The POWR grade in April 2023 started as a C (Neutral) and maintained that status but showed a marginal improvement in rank within the Specialty Retailers category, moving from rank #36 to #35 out of 43 stocks.
- In May 2023, the grade dipped to D (Sell) briefly but soon recovered back to C (Neutral) throughout the month. The rank during this month fluctuated slightly between ranks #34 and #35.
- In June 2023, there was a significant drop, with the POWR grade falling to D (Sell) and the rank deteriorating to #40.
- The POWR grade maintained a D (Sell) status from July to August 2023. During this period, the rank showed a decreasing trend, going from an initial #40 to a worrying #41, indicating poor performance within the Specialty Retailers category.
- September 2023 witnessed a brief improvement mid-month when the POWR grade jumped back to a C (Neutral), and the rank improved slightly to #37. However, it again fell to a D (Sell) alongside its rank of #36.
- As of October 4, 2023, the latest available value, GME, received a POWR grade of D (Sell). It held a slightly better ranking within its category, standing at rank number #35.
Overall, GME's POWR grade for the observed period consistently alternated between C (Neutral) and D (Sell), and its category rank remained relatively lower - indicating a relatively poorer performance compared to other stocks in the Specialty Retailers category.
Looking at the POWR Ratings for GME, we can identify the three most noteworthy dimensions over the course of time. These are Growth, Momentum, and Quality.
Growth:
- On April 29, 2023, the Growth rating stood high at 94.
- There is a clear gradual decrease observed with ratings of 92 in May 2023, 83 in June, 81 in July, and 79 in August.
- An upturn was noticed in September 2023 with a value of 92, reaching a peak of 97 on October 3, 2023.
Momentum:
- Momentum showed a mixed trend beginning at 19 on April 29, 2023.
- A downward trend is noticed till June 2023, when it was at its lowest at 8, afterward increasing to 24 in July, then slightly rising to 25 in August.
- In the following months, there's a minor decline to 16 in September, again dropping to 11 on October 3, 2023.
Quality:
- The Quality dimension started strong with a rating of 72 on April 29, 2023.
- This was followed by an increase in May, reaching 75, then a substantial drop to 63 in June, and further slipping to 60 in July.
- Continuing the downward trend, it lowered to 59 in August and 56 in September, bottoming out at 53 on October 3, 2023.

How does GameStop Corp. (GME) Stack Up Against its Peers?
Other stocks in the Specialty Retailers sector that may be worth considering are Betterware de México, S.A.P.I. de C.V. (BWMX), The Aaron's Company, Inc. (AAN), and NEXT plc (NXGPY) - they have better POWR Ratings. Click here to explore more stocks in the Specialty Retailers industry.
What To Do Next?
43 year investment veteran, Steve Reitmeister, has just released his 2024 market outlook along with trading plan and top 11 picks for the year ahead.
GME shares were trading at $14.67 per share on Wednesday afternoon, up $0.07 (+0.48%). Year-to-date, GME has declined -20.53%, versus a 12.04% rise in the benchmark S&P 500 index during the same period.
About the Author: Anushka Dutta

Anushka is an analyst whose interest in understanding the impact of broader economic changes on financial markets motivated her to pursue a career in investment research.
The post October Gameplan for GameStop (GME) - Buy or Sell? appeared first on StockNews.com