
Target Corporation’s (TGT) sales have been witnessing a slowdown due to the shift in consumer demand from discretionary purchases to essential goods. The gloomy annual forecast issued by the company has resulted in investor apprehension about the stock.
However, the retail giant has been progressively restoring its business profitability. Despite subdued sales, its most recent quarterly earnings exceeded market predictions. Given that many economists are no longer projecting a recession and government data indicates tempering inflation, the Wall Street consensus is that TGT’s third-quarter revenue and EPS will clock in at $25.24 billion and $1.48, respectively.
TGT is also lauded for its impressive legacy of delivering uninterrupted dividend growth for 54 consecutive years.
Even though the topline trends have been less than satisfactory, the stock is currently trading at an appealing valuation ahead of its earnings release. Investors with a long-term perspective might find now to be an opportune moment to invest in the stock. To understand the current situation comprehensively, let’s examine some of Target’s key financial metrics.
Analyzing Target Corporation’s Financial Trends: Revenue Growth Despite Declining Margins and Net Income
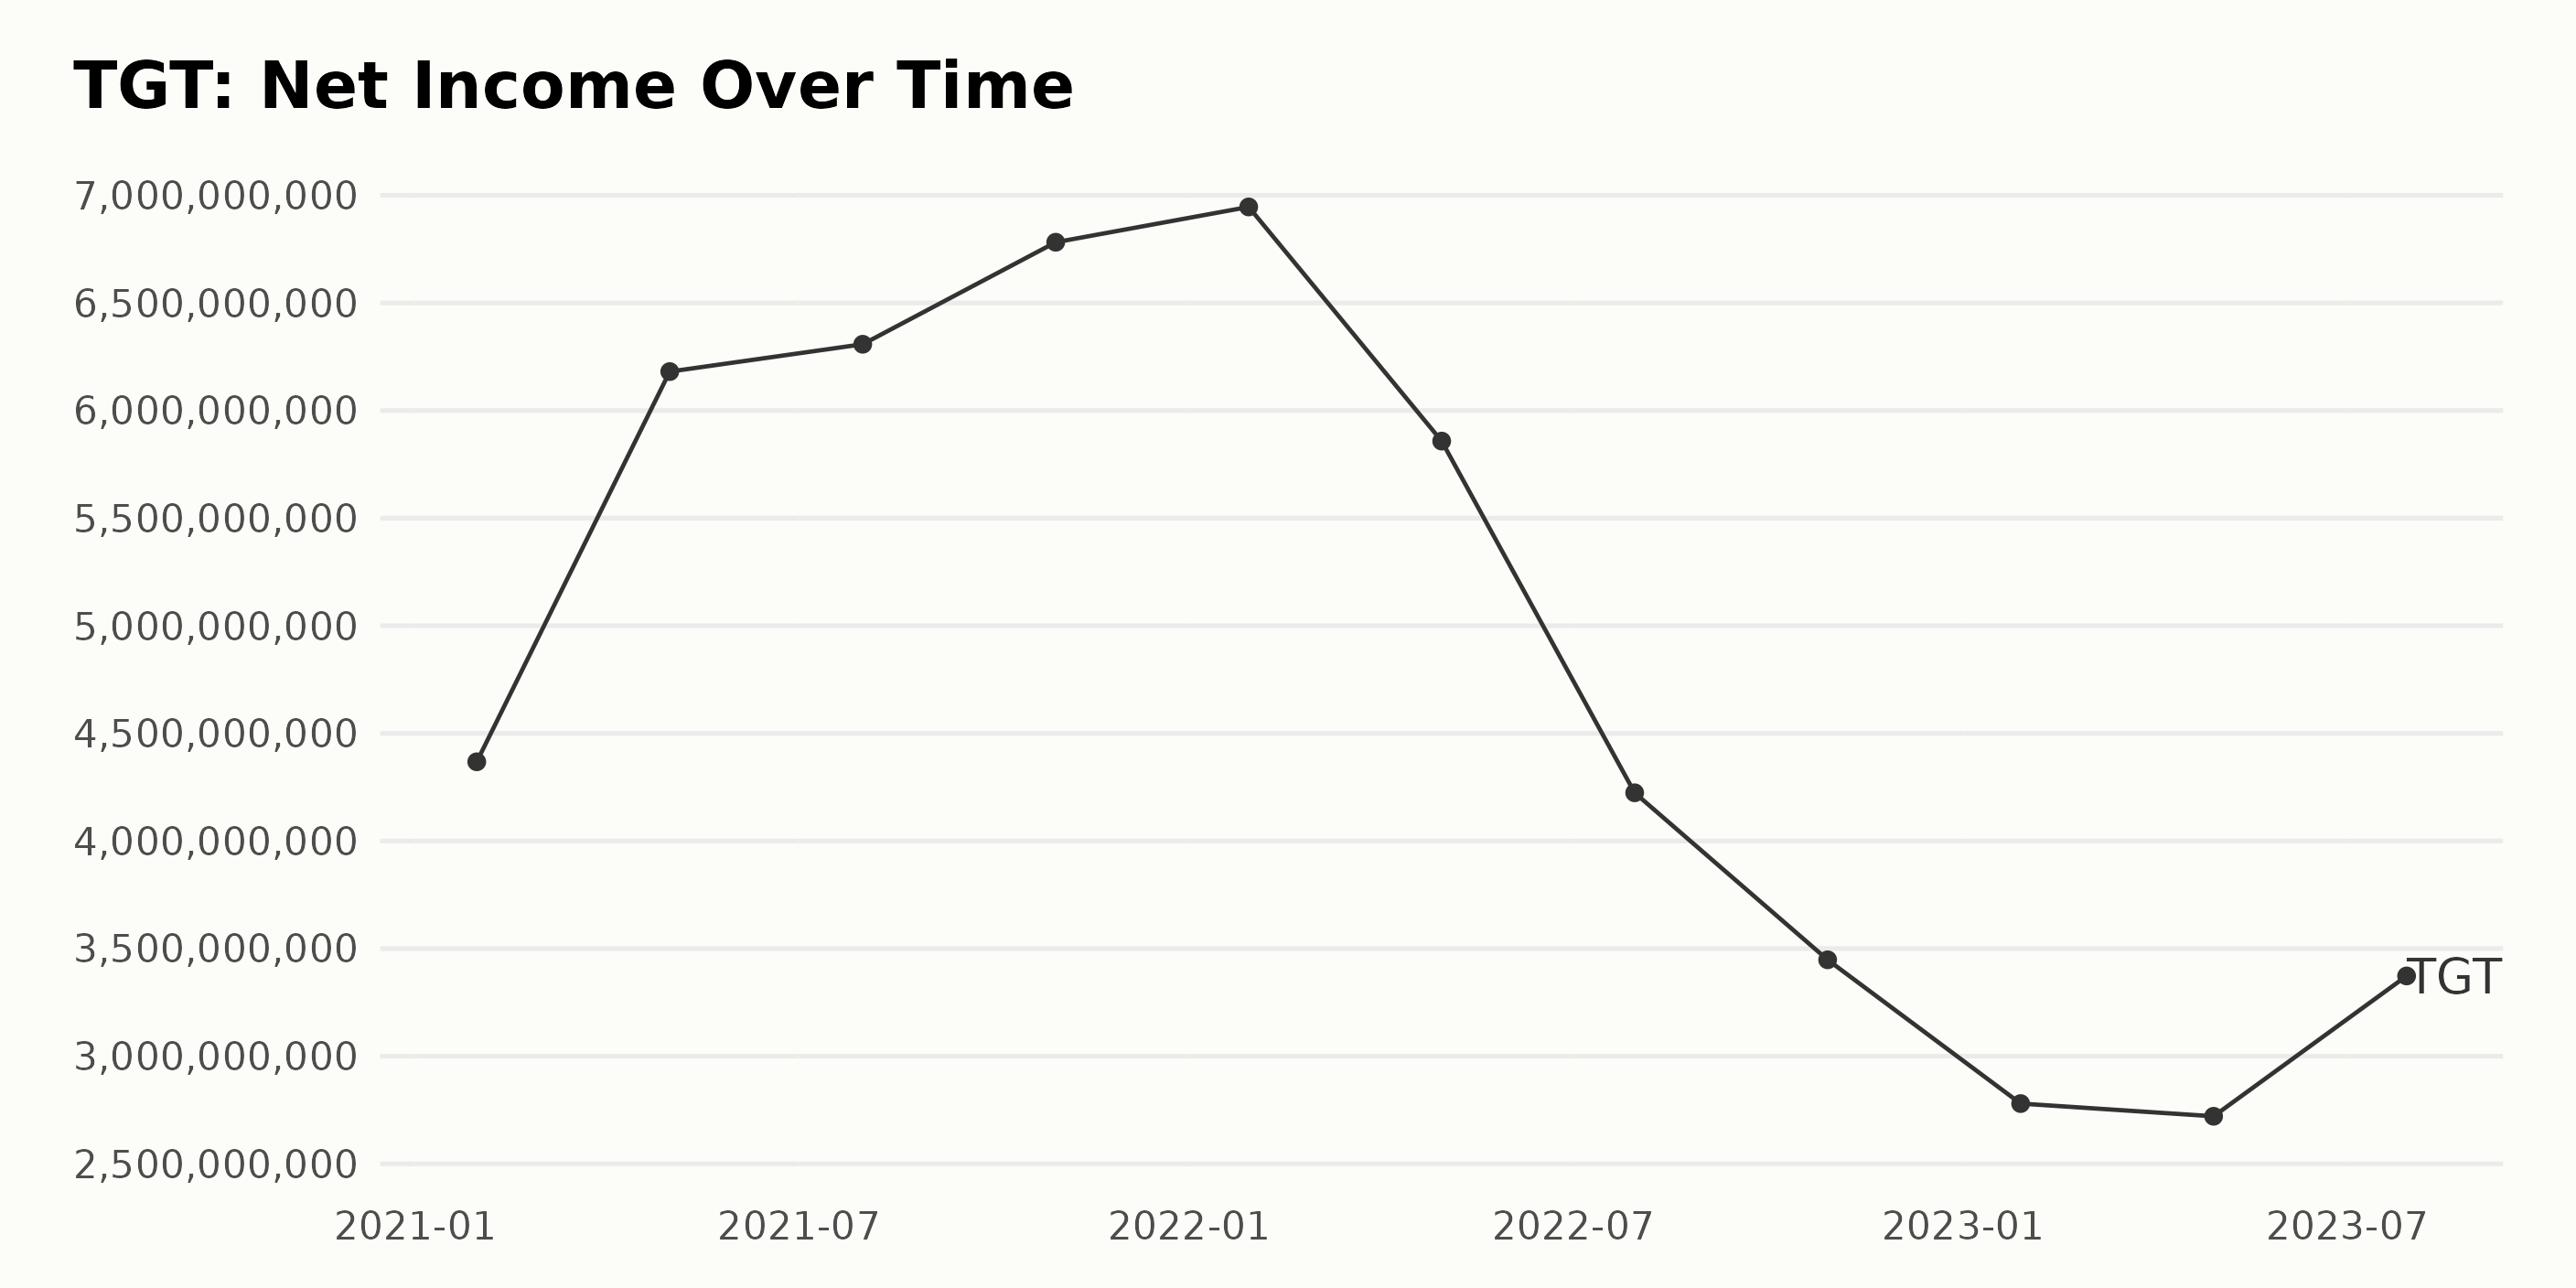
The summary of the trailing-12-month Net Income trend and fluctuations for Target Corporation (TGT) are as follows:
- At the start of the data series on January 30, 2021, Target Corporation recorded a Net Income of $4.37 billion.
- A noticeable growth was observed from January 30, 2021, to May 1, 2021 occurring with a significant jump to $6.18 billion -- a clear reflection of positive performance at the time.
- Target’s Net Income continued along an upward trajectory, peaking at $6.94 billion by January 29, 2022.
- From this high, there was a distinct downward trend from January 2022 through to April 2023, with the Net Income falling to its lowest of $2.72 billion in April 2023, nearly a 61% decline from its highest value.
Very recent data indicates that the Net Income made a marginal recovery in the next quarter to $3.37 billion on July 29, 2023. However, this figure is still noticeably lower than previous years’ numbers. Calculating the overall growth rate from the first value to the last, we find that the net growth is negative -24.83%. In conclusion, while the evident trend within this period had shown some promising peaks, the later part of the series suggests a downturn trend for TGT’s Net Income, which hopefully doesn’t continue. However, slight signs of recovery in the most recent data could provide some optimism.
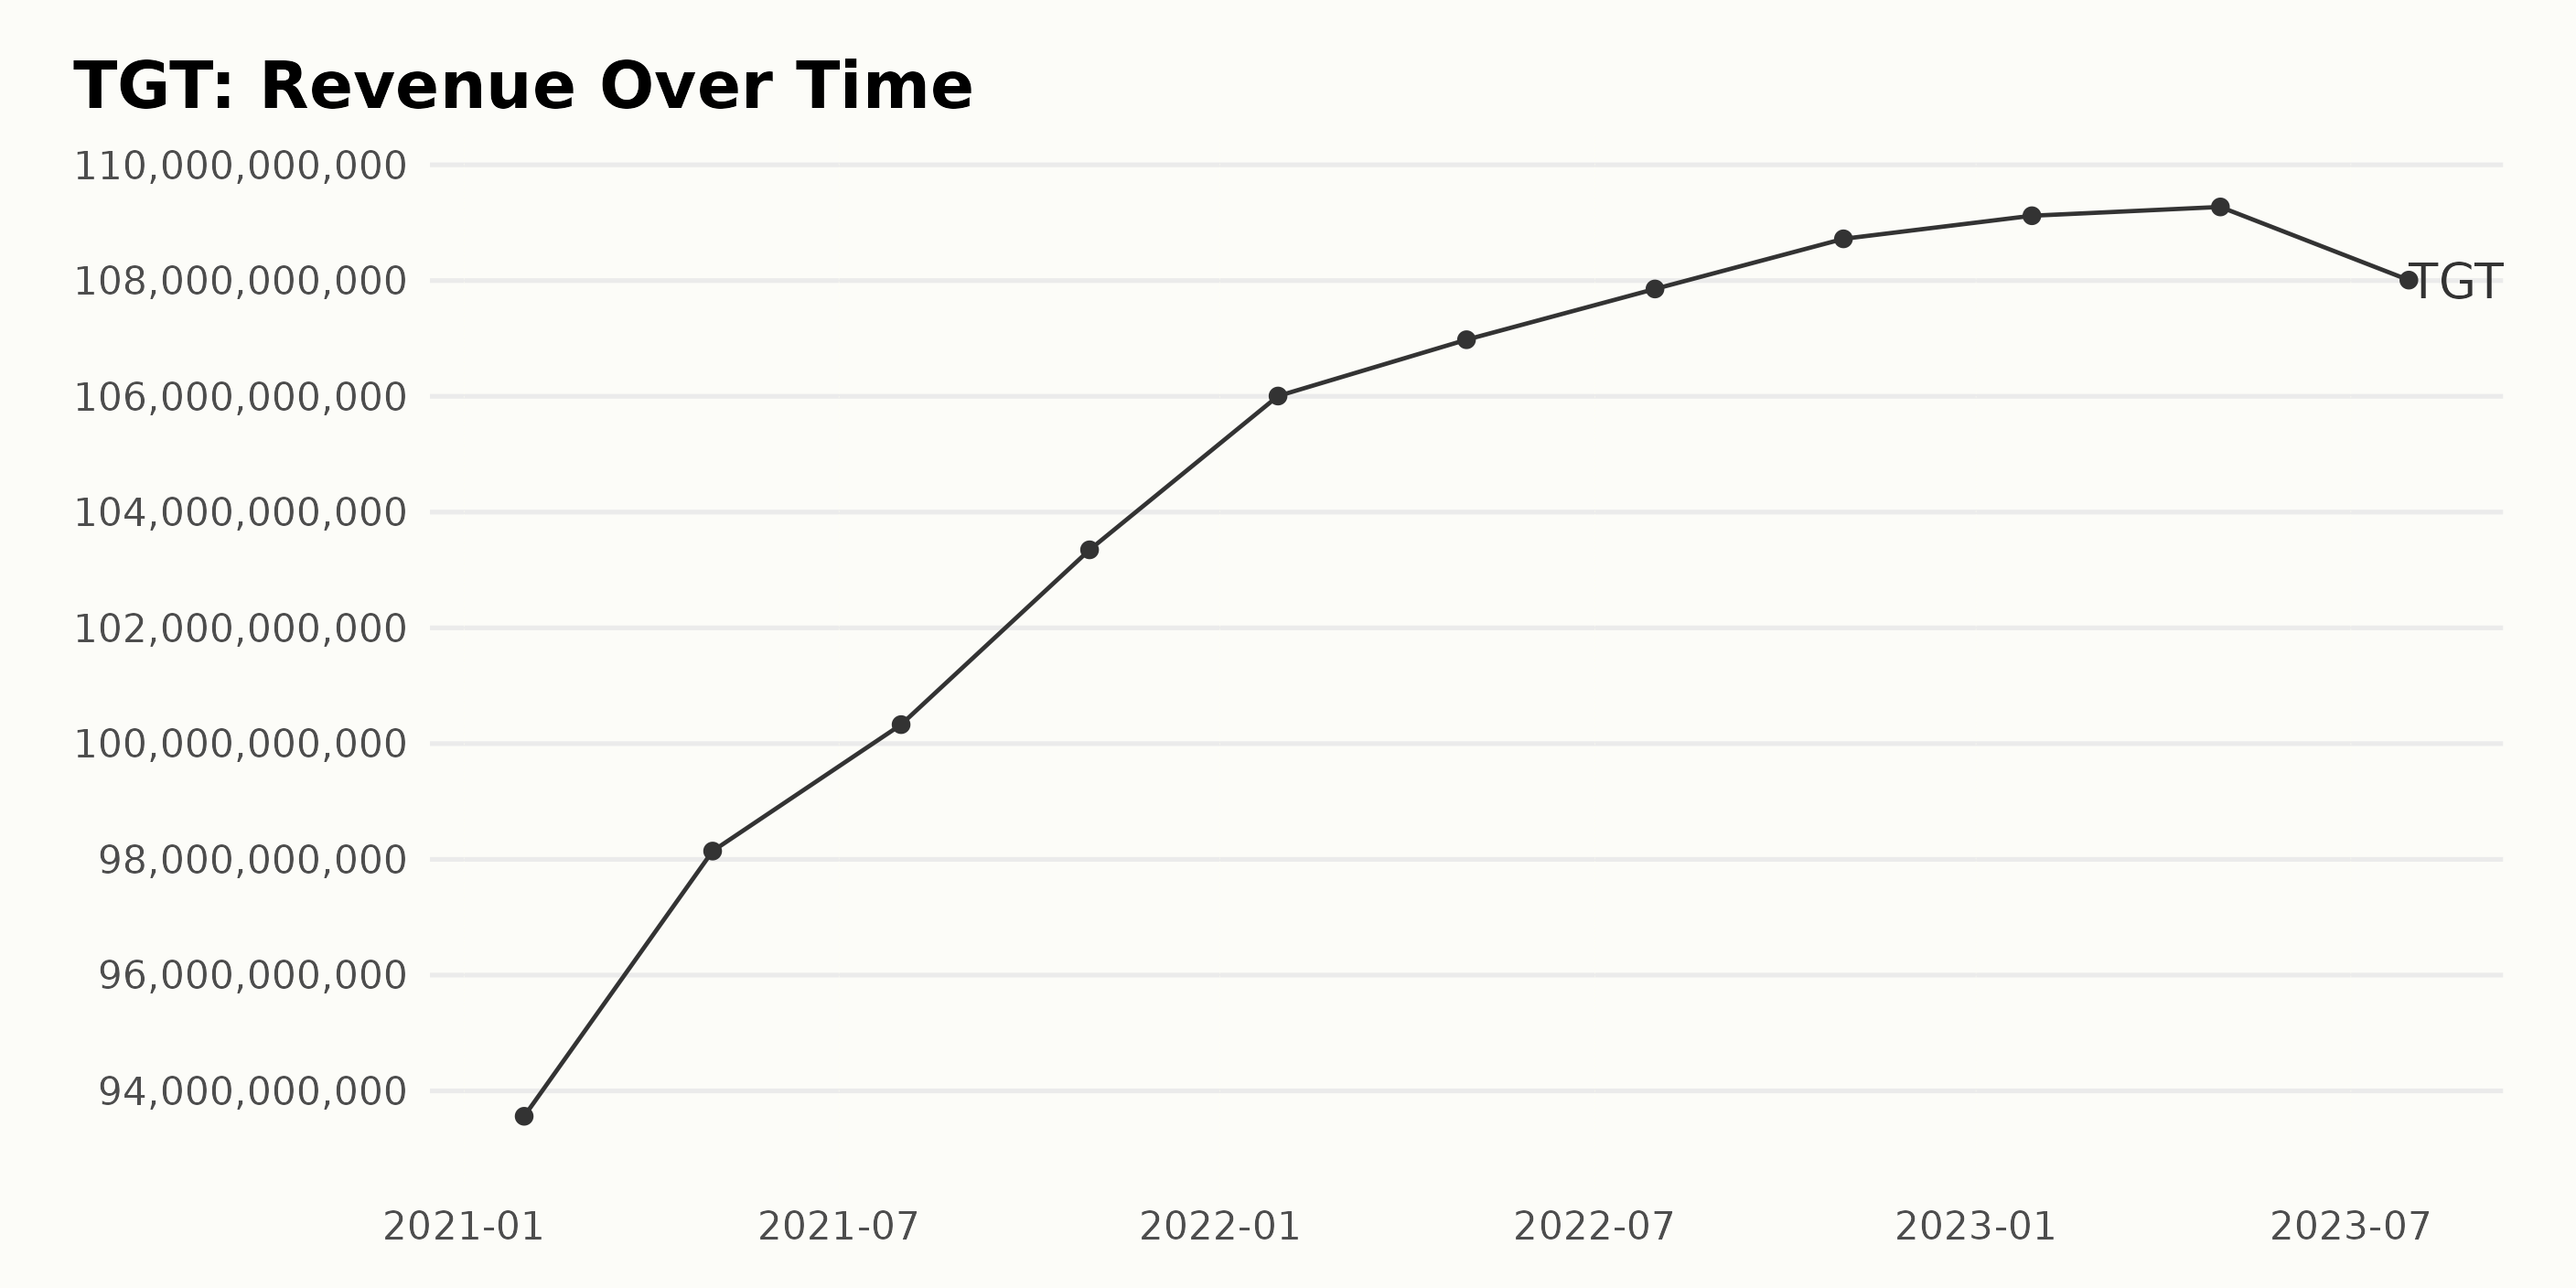
Analyzing the data series, the trailing-12-month revenue trend for Target Corporation (TGT) shows a generally positive growth rate over the selected period. The revenue began from $93.56 billion as of January 30, 2021, and demonstrated an increase over time, reaching $109.27 billion as of April 29, 2023. With a slight decline identified as of July 29, 2023, the final stated value in the series is marked at $108.01 billion. Key highlights can be drawn from the data:
- Close examination of revenue fluctuations across 2021 indicates steady progress. Starting from $93.56 billion in January 2021, it increased to $98.14 billion by May 2021, followed by a continuous upsurge to reach $103.35 billion by October 2021.
- Sequestrating into 2022, the upward trend persisted with marginal fluctuations. Revenue rose to $106 billion by January 2022, slightly scaled to $106.98 billion as of April 2022, and maintained an ascendant route to reach $108.72 billion by October 2022.
- Carrying forward into 2023, a varying trajectory is observable. A slow rise was noted from $109.12 billion in January to $109.27 billion by April. However, revenue trailed off to $108.01 billion by July, marking a mild downturn after consistent increments.
Taking into account the series’ first and last values, the calculated growth rate from January 2021 to July 2023 is approximately 15.43%. While certain variations were spotted during this period, the larger trend suggests reliable and robust revenue growth. A note of caution is warranted for the minor revenue dip towards the end of the series.
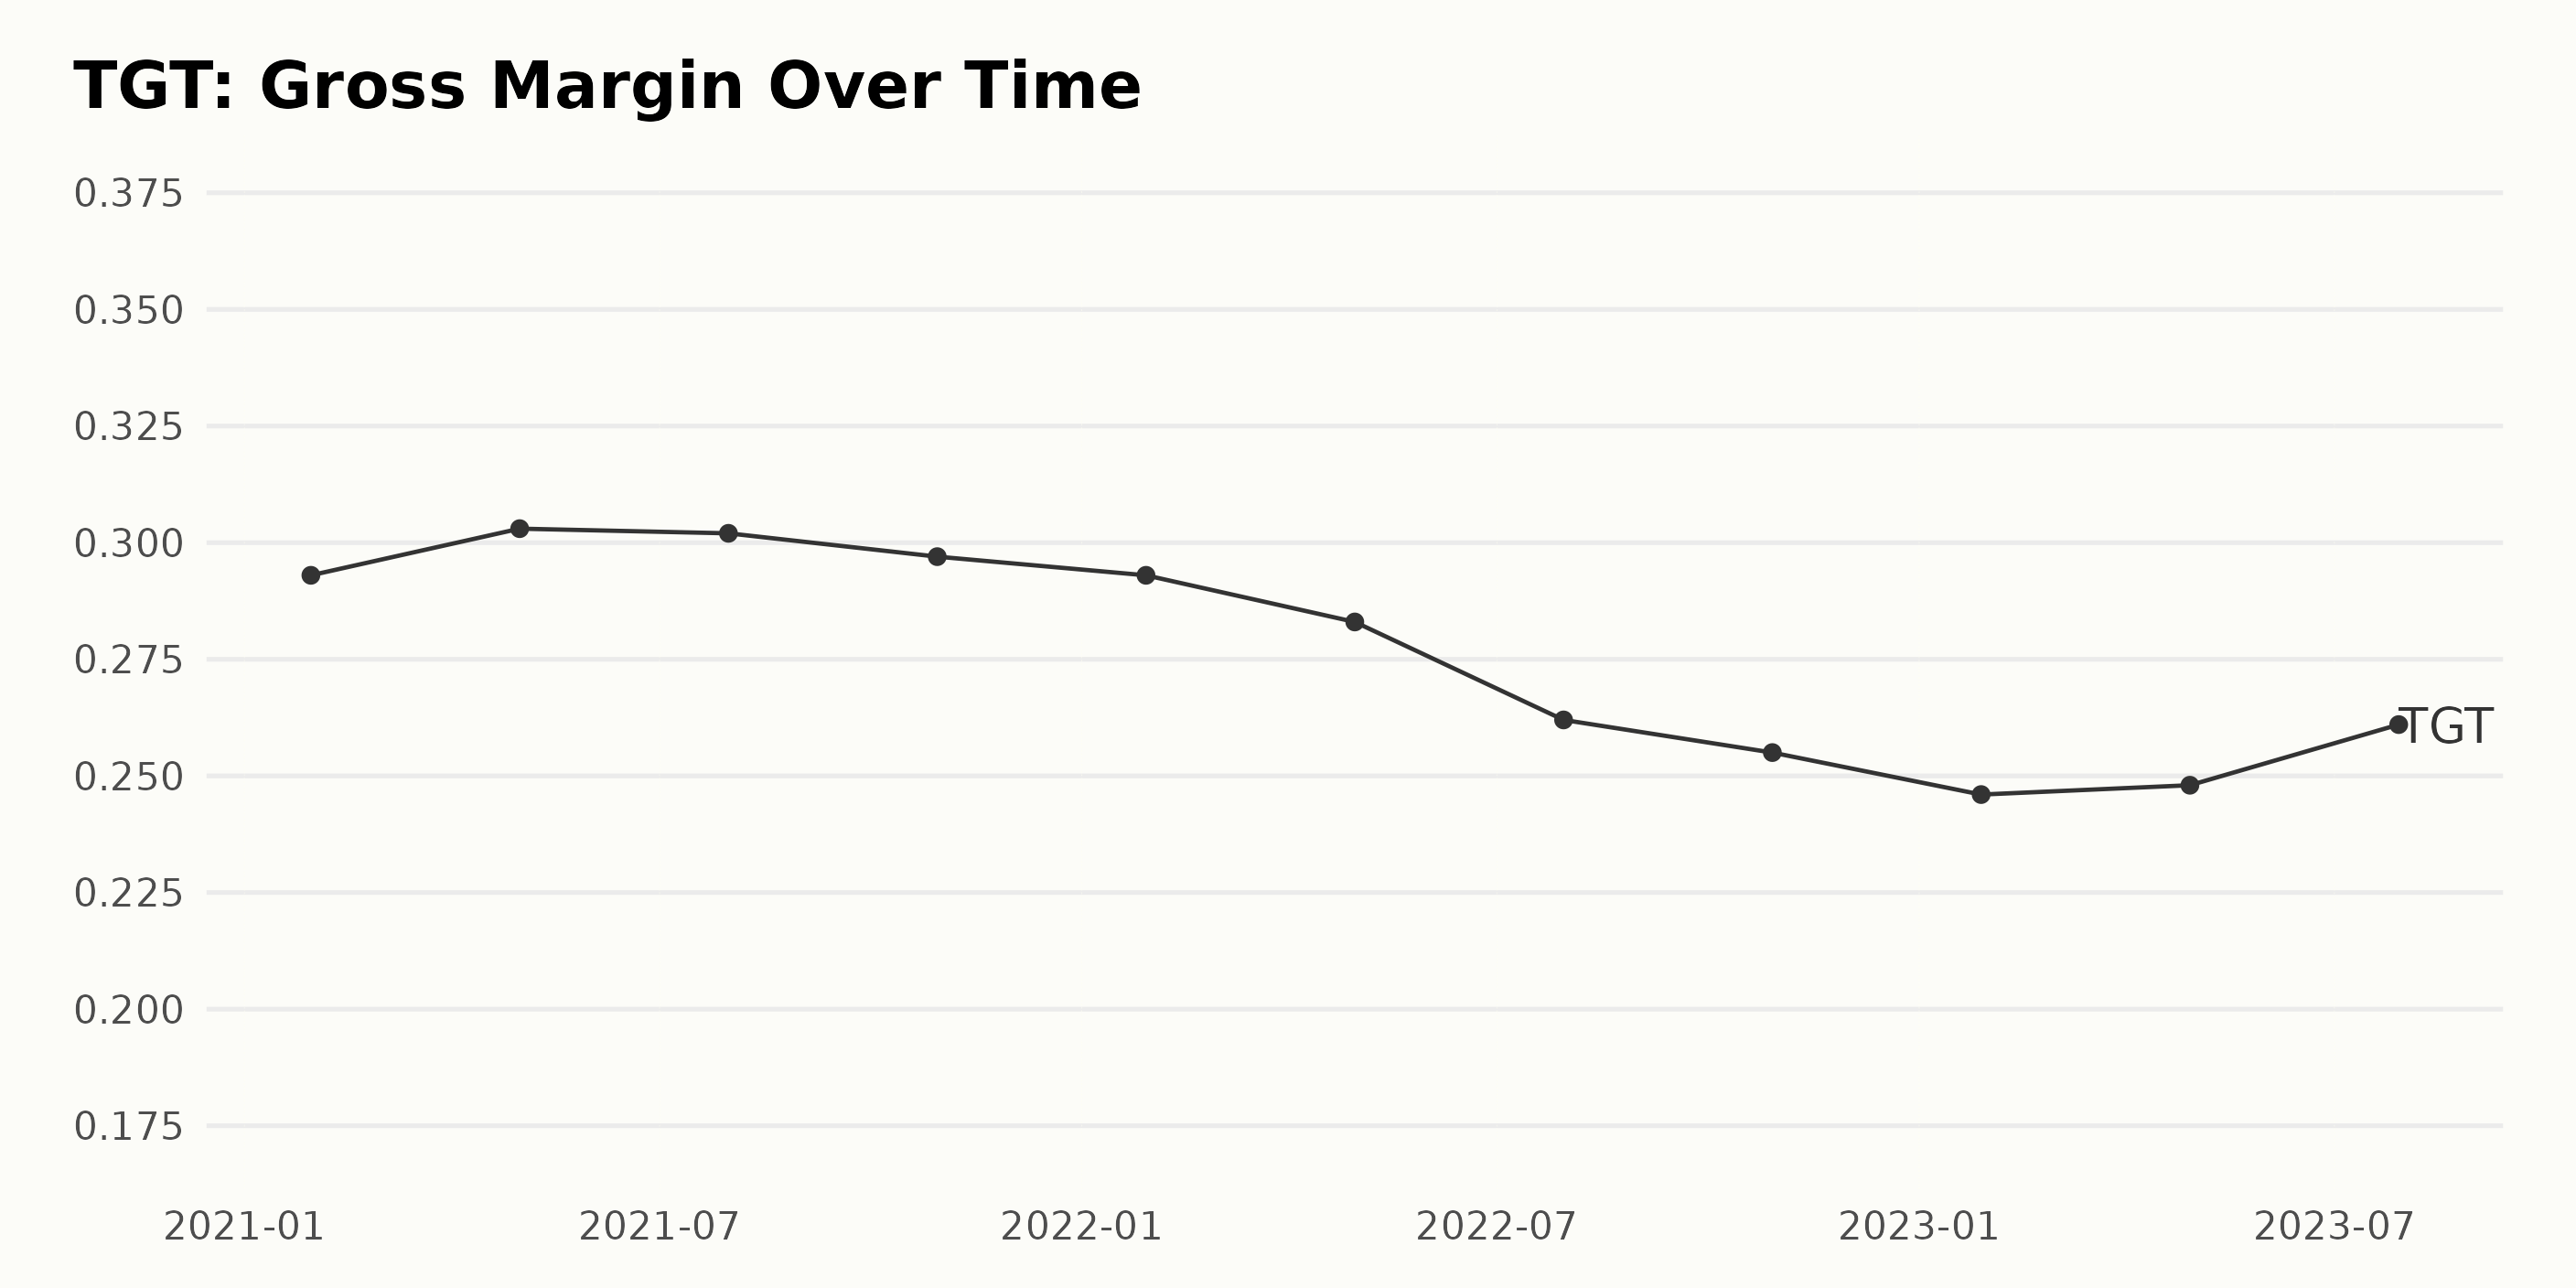
Analyzing the Gross Margin of Target Corporation (TGT) over the specified timeline, we can chronicle a series of fluctuations marked by a declining trend. Specifically:
- Starting from January 2021 with a Gross Margin of 29.3%, TGT slightly increased its margin to 30.3% by May 2021.
- This was followed by a small decrease to 30.2% by July 2021, then further down to 29.7% by October 2021.
- By January 2022, the Gross Margin fell back to 29.3% before experiencing significant drops - first to 28.3% in April 2022 and then markedly lower to 26.2% by July 2022.
- In October 2022, there was a further dip to 25.5%.
- This falling trend continued into January 2023 where it reached a low of 24.6% before finally staging a slight rebound.
- The Gross Margin rose to 24.8% by April 2023 and further escalated to 26.1% by July 2023.
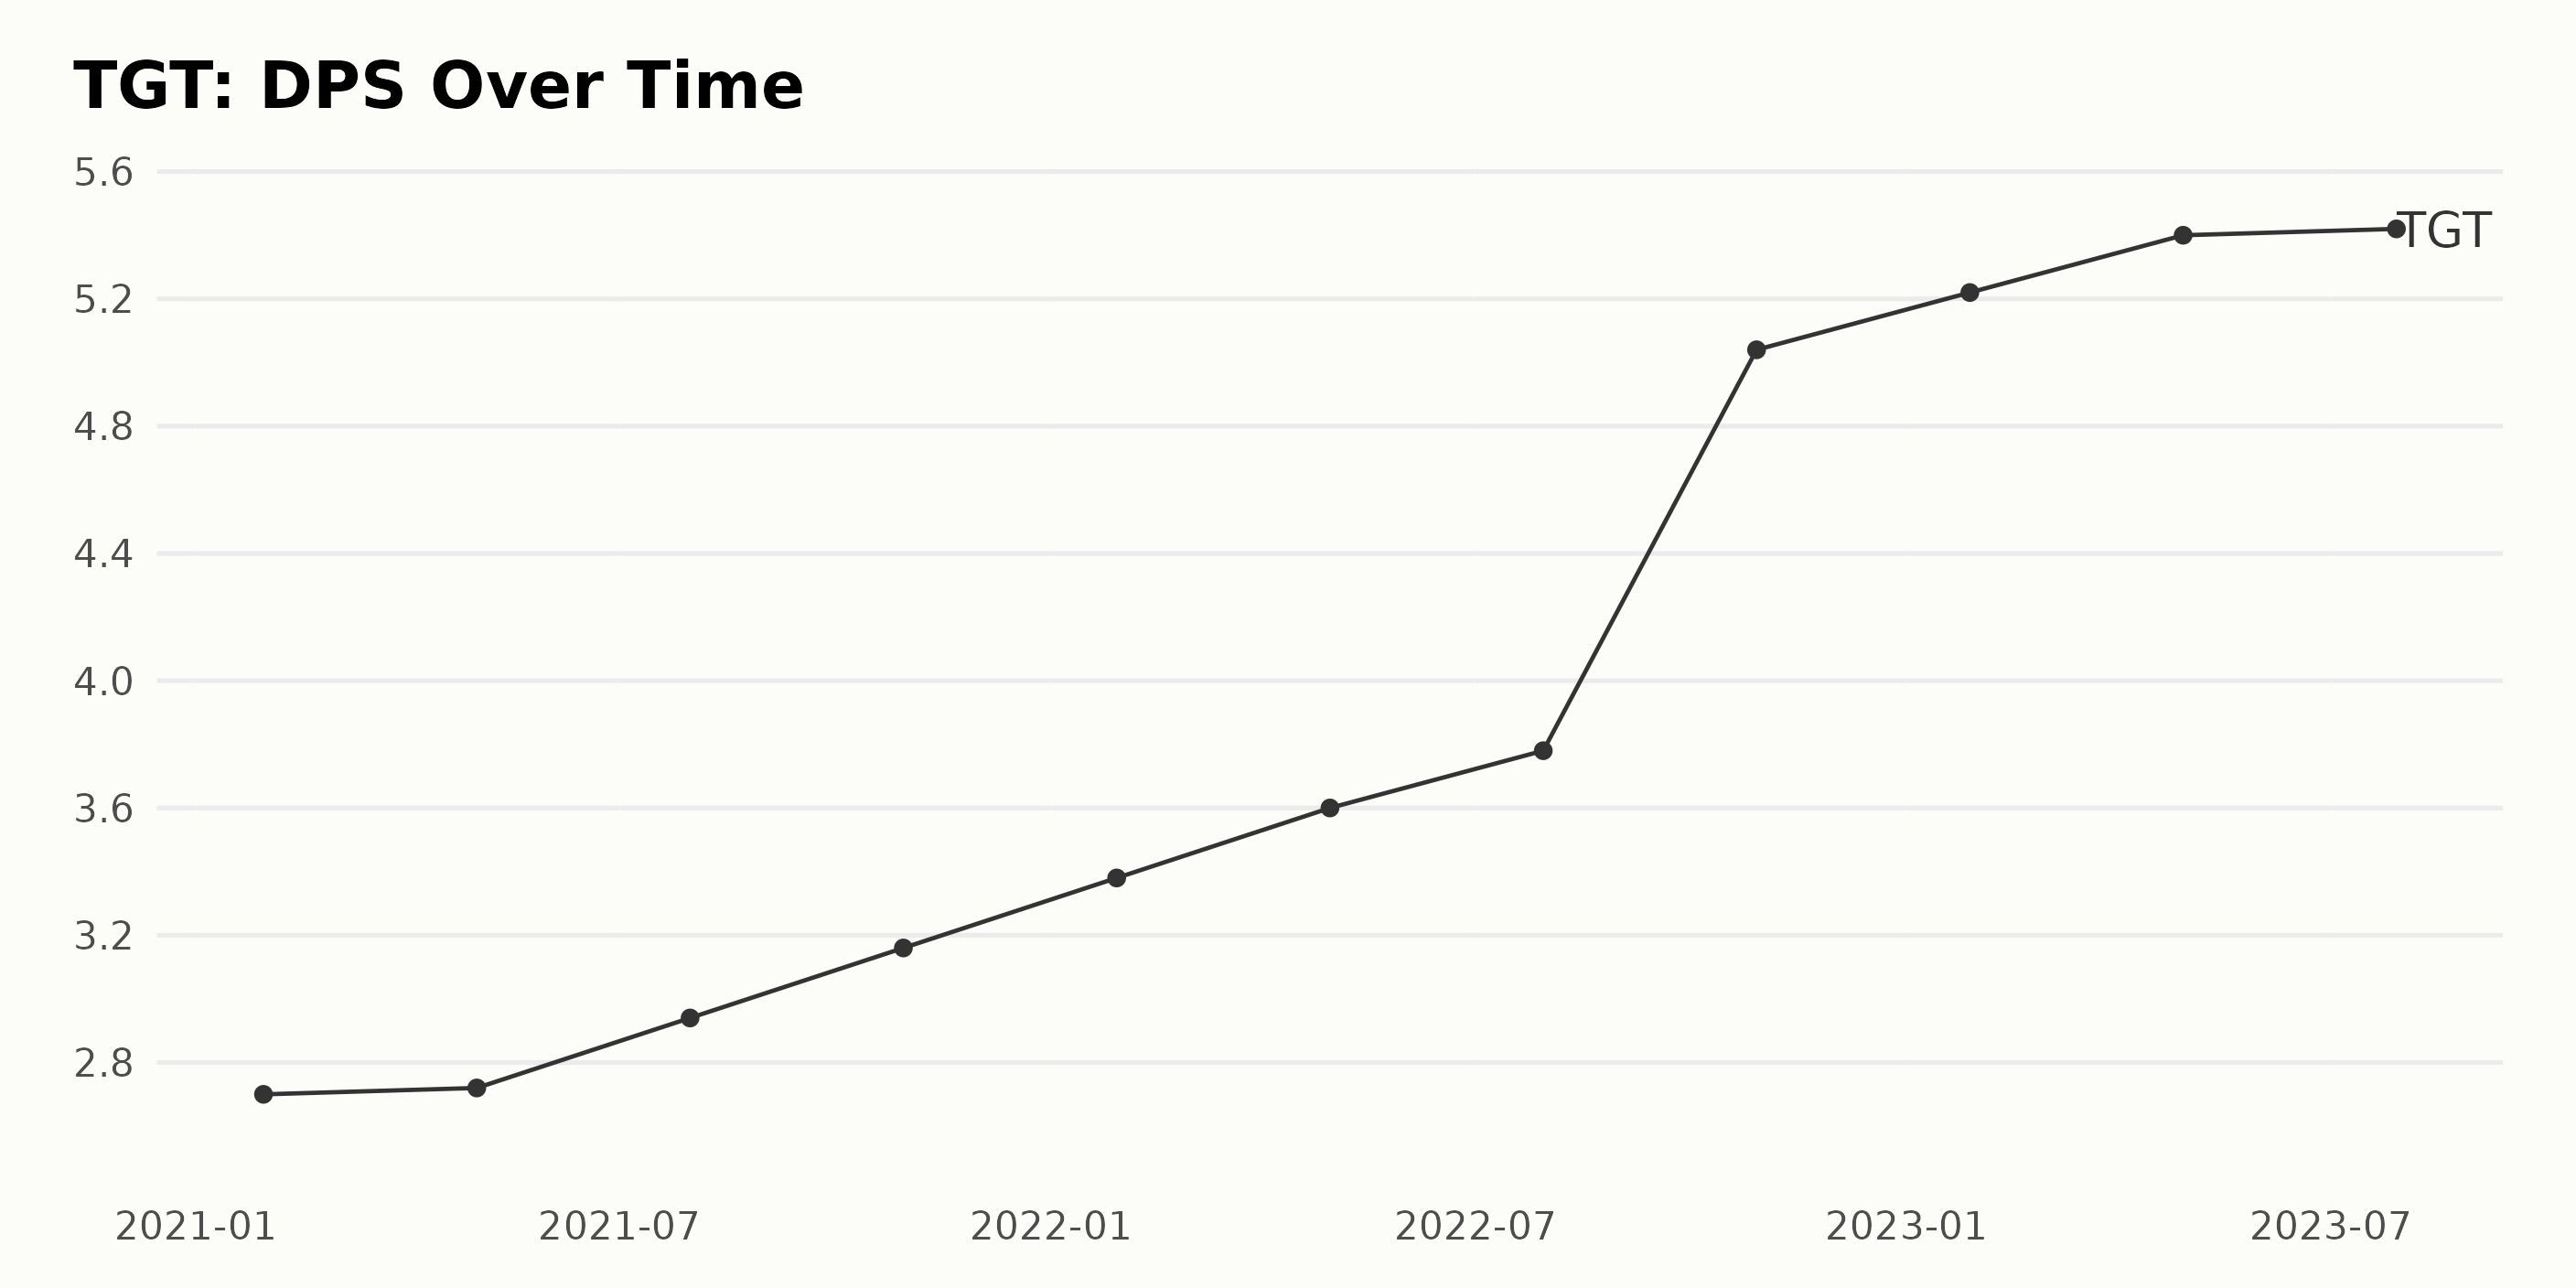
The provided data corresponds to the Dividends Per Share (DPS) of the notably traded US company, Target Corporation (TGT), over a continual period of two and a half years from the beginning of January 2021 to the end of July 2023. The data reveals a general upward trend with certain fluctuations in the DPS of TGT. Specifying the chronology, we notice:
- On January 30, 2021, the reported DPS value initiated at $2.70.
- By May 01, 2021, it witnessed slight elevation reaching up to $2.72.
- Further progression was traced by the end of July 2021 reporting a DPS value of $2.94.
- A steady rise continued through October 2021, marking a DPS value of $3.16.
- At the dawn of 2022, on January 29, the value climbed to $3.38.
- The subsequent months till October 2022 reported incrementally rising values - $3.60 (April 30, 2022), $3.78 (July 30, 2022), eventually peaking to a significant jump of $5.04 (October 29, 2022). This upward leap marked a major point in the given time series.
- Post this remarkable surge, the DPS value continued to hike marginally peaking at $5.22 in January 2023.
- It further edged to $5.40 by April 29, 2023.
Lastly, a nearly flat trajectory was exhibited towards the terminal part of the timeline with the last recorded DPS value being $5.42 on July 29, 2023. Upon measuring the last value from the first, a remarkable growth rate of over 100% is evident throughout the said period. The DPS value appears to have almost doubled from its initial stages.
To summarize, Target Corporation’s DPS displays a predominantly rising trend interspersed with few fluctuations over this span. The growth rate appears relatively robust, especially considering the tangible upsurge around October 2022. Through this data analysis, it can be inferred that some investing potential may be associated with TGT, asserting an emphasis on more recent data and the terminal value in the series.
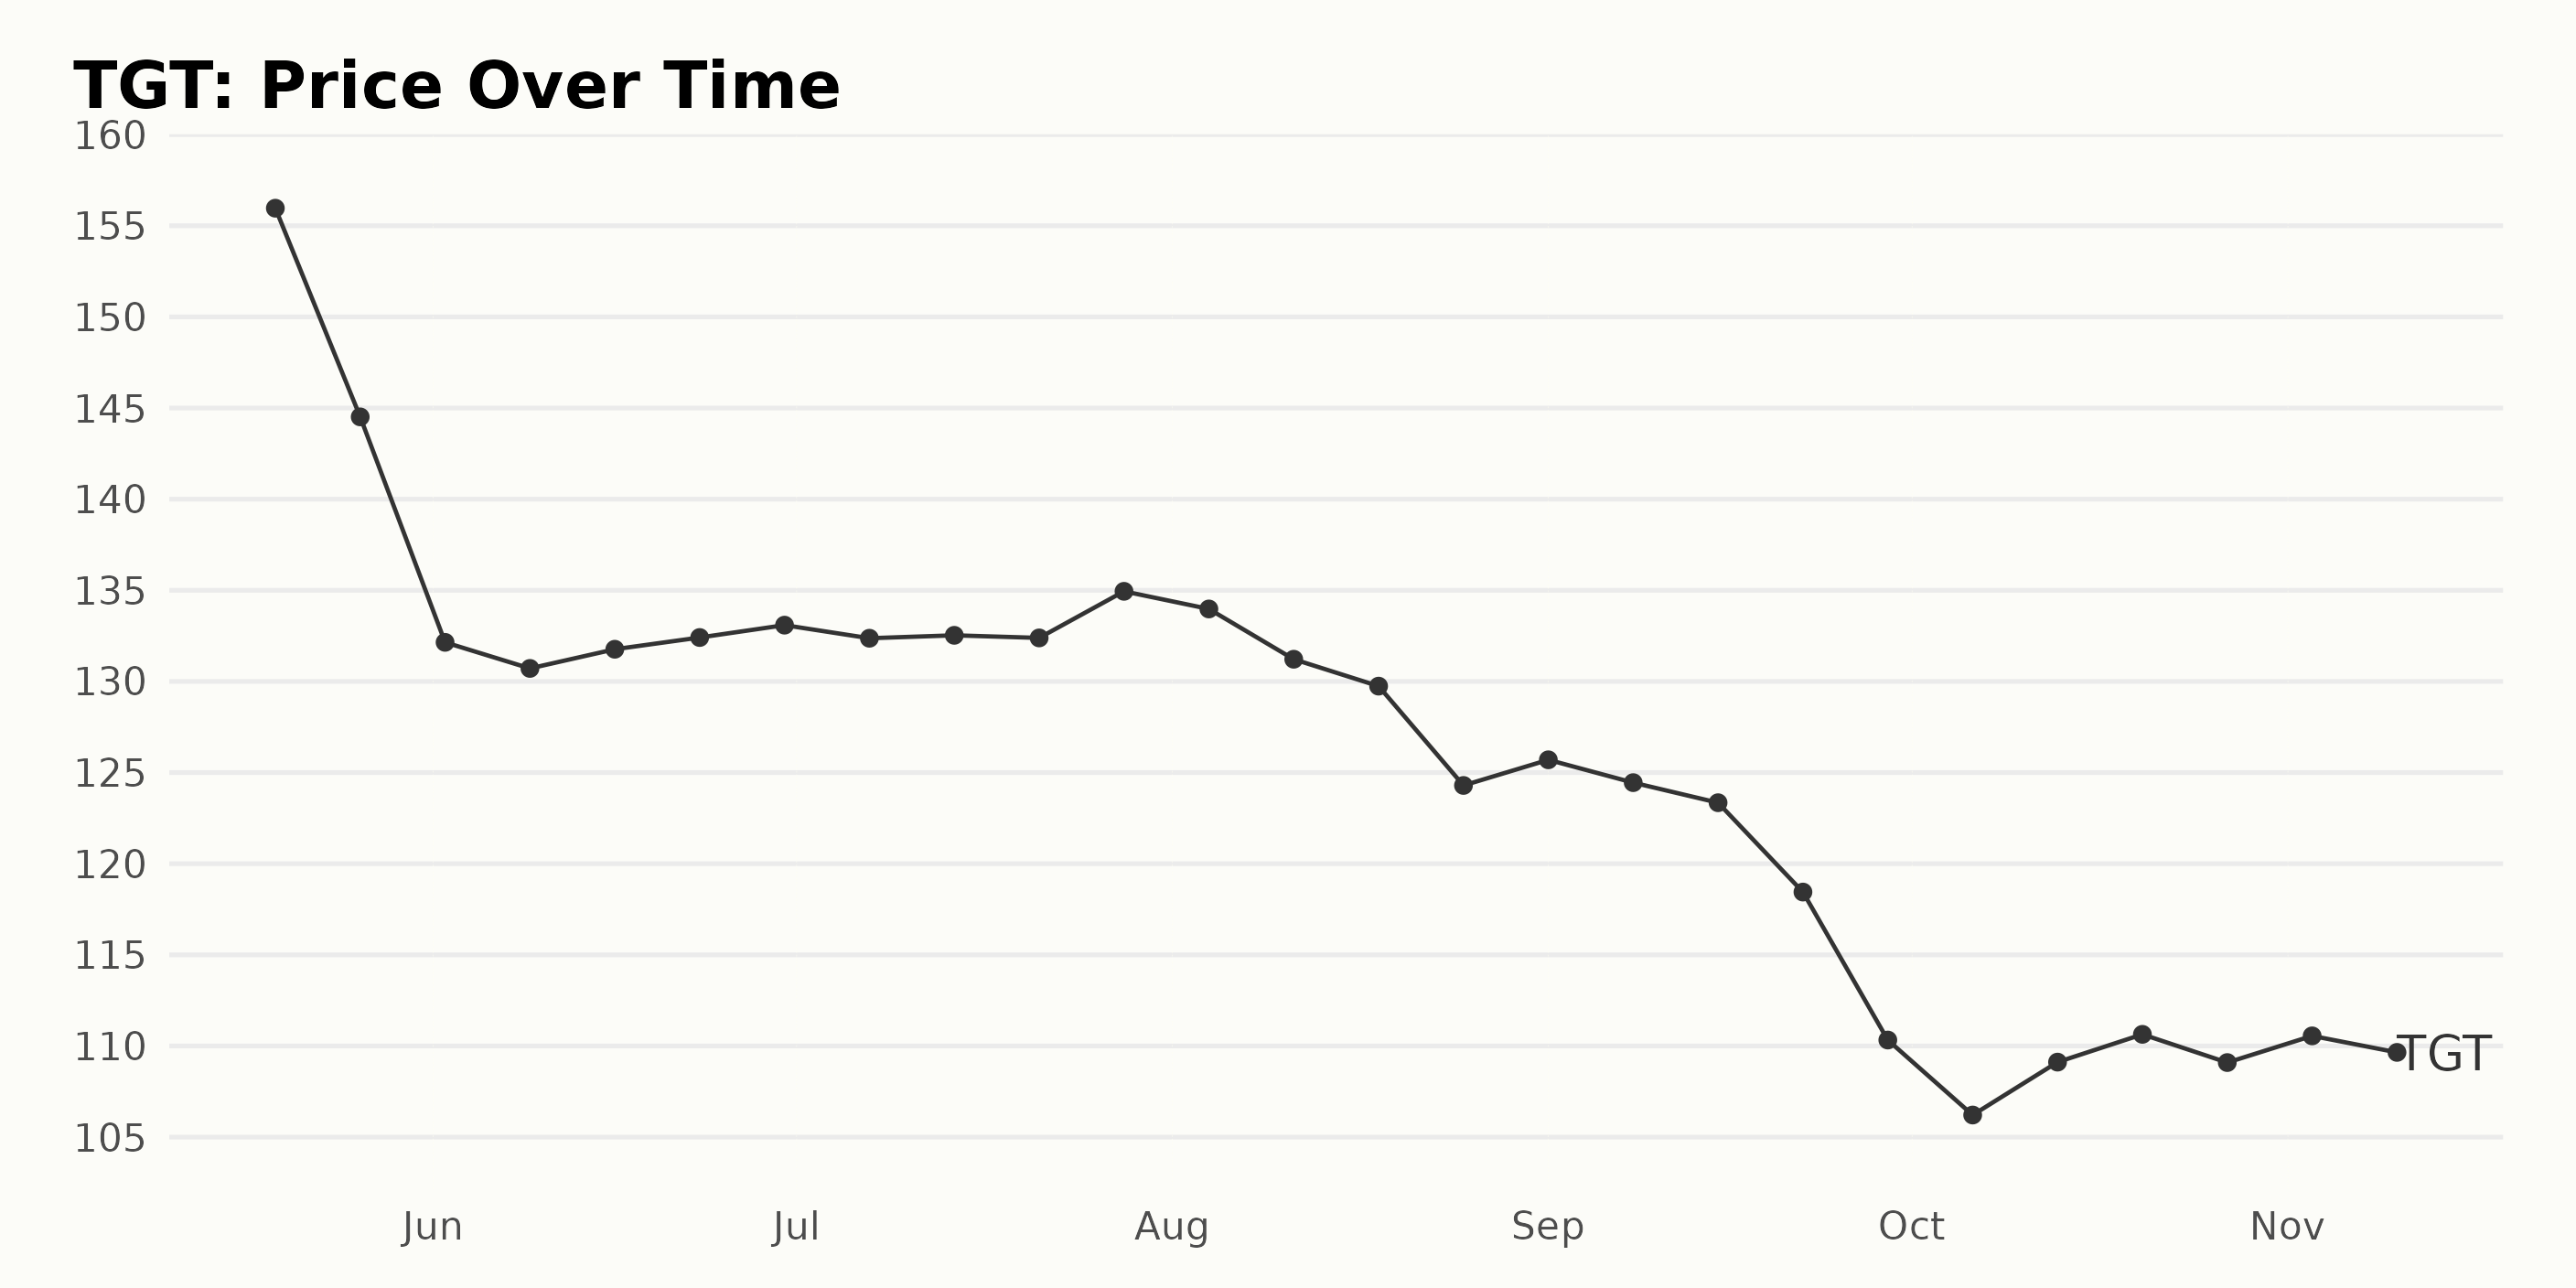
Analyzing Target Corporation’s Share Price Fluctuation from May to November 2023
Looking at the provided data for Target Corporation (TGT), we can observe a few key trends in its share price progression from May 2023 to November 2023:
- On May 19, 2023, the share price was at $155.96.
- There was an initial decline towards the end of May and continued through early June with the lowest point on June 2, 2023, where the price dropped to $132.15, a downward shift of approximately 15% from the starting point.
- From mid-June to late July 2023, the share price then experienced a period of stabilization fluctuating around the $132 mark.
- A slight increase is seen by end of July, reaching $134.94.
- This was followed by another downward trend from August through to late September with the share price reaching a low of $110.33 which represents roughly an 18% drop from the July peak.
- In the latter part of the year from October to November, prices began to show a slight recovery fluctuating around the $110 mark.
In terms of growth rate, the data exhibits a generally negative trajectory. This period indicates a decelerating trend overall for Target Corporation’s share price. Here is a chart of TGT’s price over the past 180 days.
Examining Target Corporation’s Growth, Value, and Momentum Ratings: A 2023 Review
TGT has an overall B rating, translating to a Buy in our POWR Ratings system. It is ranked #25 out of the 38 stocks in the Grocery/Big Box Retailers category.
The POWR Ratings for Target Corporation (TGT) indicate a notable trend across three significant dimensions: Growth, Value, and Momentum.
Growth
- In May 2023, the growth dimension rating was at 26.
- This rating appreciably increased to 74 in June and July 2023.
- However, there was a noticeable decline to 53 in August 2023, continuing to drop further to 37 in September 2023, remaining consistent in October, and slighting dropping to 36 in November 2023.
Value
- The value dimension demonstrated a steady incline throughout the observed period.
- Beginning at 66 in May 2023, the rating improved to 78 in June 2023.
- It continued to rise, reaching 80 in July, 84 in August and September, and eventually peaking at 86 in October 2023.
- Despite a minor fall to 85 in November 2023, the value dimension remained high.
Momentum
- The momentum dimension showcased an oscillating pattern. From an initial rating of 70 in May 2023, it decreased to 58 in June 2023, and then rebounded to 67 in July 2023.
- The rating then exhibited an upward trend, rising from 73 in August to 79 in November 2023.
Conclusively, despite substantial fluctuations in the growth rating, Target Corporation exhibited positive trends in the Value and Momentum dimensions over the considered period.
How does Target Corporation (TGT) Stack Up Against its Peers?
Other stocks in the Grocery/Big Box Retailers sector that may be worth considering are RYOHIN KEIKAKU CO., LTD. (RYKKY), Village Super Market Inc. (VLGEA), and Natural Grocers by Vitamin Cottage Inc. (NGVC) -- they have better POWR Ratings.
What To Do Next?
Discover 10 widely held stocks that our proprietary model shows have tremendous downside potential. Please make sure none of these “death trap” stocks are lurking in your portfolio:
TGT shares were trading at $107.75 per share on Monday afternoon, down $0.58 (-0.54%). Year-to-date, TGT has declined -26.13%, versus a 16.58% rise in the benchmark S&P 500 index during the same period.
About the Author: Subhasree Kar

Subhasree’s keen interest in financial instruments led her to pursue a career as an investment analyst. After earning a Master’s degree in Economics, she gained knowledge of equity research and portfolio management at Finlatics.
The post Target Corporation (TGT) Earnings Forecast and Gameplan appeared first on StockNews.com