
Telecom giant AT&T Inc. (NYSE: T) spun off its Warnermedia division to merge with Discovery Networks to form Warner Bros. Discovery Inc. (NYSE: WBD) to reduce some of its massive debt load. AT&T originally acquired Time Warner in an $85 billion deal in 2018 after acquiring Direct TV for $48.5 billion in 2015. It unloaded its Time Warner division for half the price it paid for it.
The goal was to cut down some of the massive debt it's accumulated through the years with poorly executed acquisitions and buying more expensive 5G spectrum to compete with the likes of Verizon Communications Inc. (NYSE: VZ) and T-Mobile US Inc. (NASDAQ: TMUS). This caused shareholders to lose their dividends temporarily. NASDAQ: WBD">Fast forward to 2023, and just as AT&T regains its footing, shares get slammed again not on the reduced debt but the rising debt servicing charges stemming from the Fed's aggressive interest rate hikes.
Interest Expense Hurting Free Cash Flow
AT&T’s net debt rose $3 billion in the past nine months due to the aggressive rise in interest rates. It's stock collapsed by (10%) on its Q1 2023 earnings release after revealing its free cash flow (FCF) of just $1 billion, far below earlier forecasts for $2.4 billion. Debt interest expense is taken out of free cash flow (FCF). FCF is critical to being able to pay its NYSE: VZ">dividend.
However, management wasn't too worried since Q1 is seasonally a light FCF period due to paying suppliers, year-end expenses and employee bonuses. They still expect to hit $14 billion of FCF for 2023. This was down from 2022's FCF of $16 billion.
Fiscal Q1 2023 Earnings Beat
On April 20, 2023, AT&T released its fiscal first-quarter 2023 results for the quarter ended March 2023. The company reported a diluted earnings-per-share (EPS) profit of $0.60, beating consensus analyst estimates by $0.01. Revenues grew 1.4% year-over-year (YOY) to $30.14 billion, missing analyst estimates of $30.22 billion. Domestic wireless service revenues rose 5.2% for the best-ever Q1 Mobility operating income.
Consumer broadband revenues grew 7.3%, driven by AT&T Fiber revenue growth of 30.7%. AT&T had 424,000 postpaid phone net additions and 272,000 Fiber net additions, its 13th straight quarter surpassing 200,000 net adds.
Network Enhancement
The company expanded its mid-band 5G spectrum coverage to over 160 million people and nationwide 5G, reaching 290 million people. It expanded its ability to serve fiber to 19.7 million customers and over three million businesses in over 100 U.S. metro areas while surpassing 30 million fiber locations by the end of 2025. The company is on track to reach a $6 billion run-rate cost savings by year's end.
The company is undergoing the replacement of its legacy copper network with best-in-class fiber connectivity and winning customers as a result. As the company reduces its copper services footprint and legacy infrastructure, it expects to improve margins and grow its EBITDA.
AT&T CEO John Stankey commented, “Think about a cost structure no longer anchored to legacy network technologies and software stacks. For example, in addition to all of fiber's enhanced resiliency and superior transport characteristics, we already see that fiber uses less energy, costs less to maintain and requires fewer service dispatches.”
Analyst Upgrade
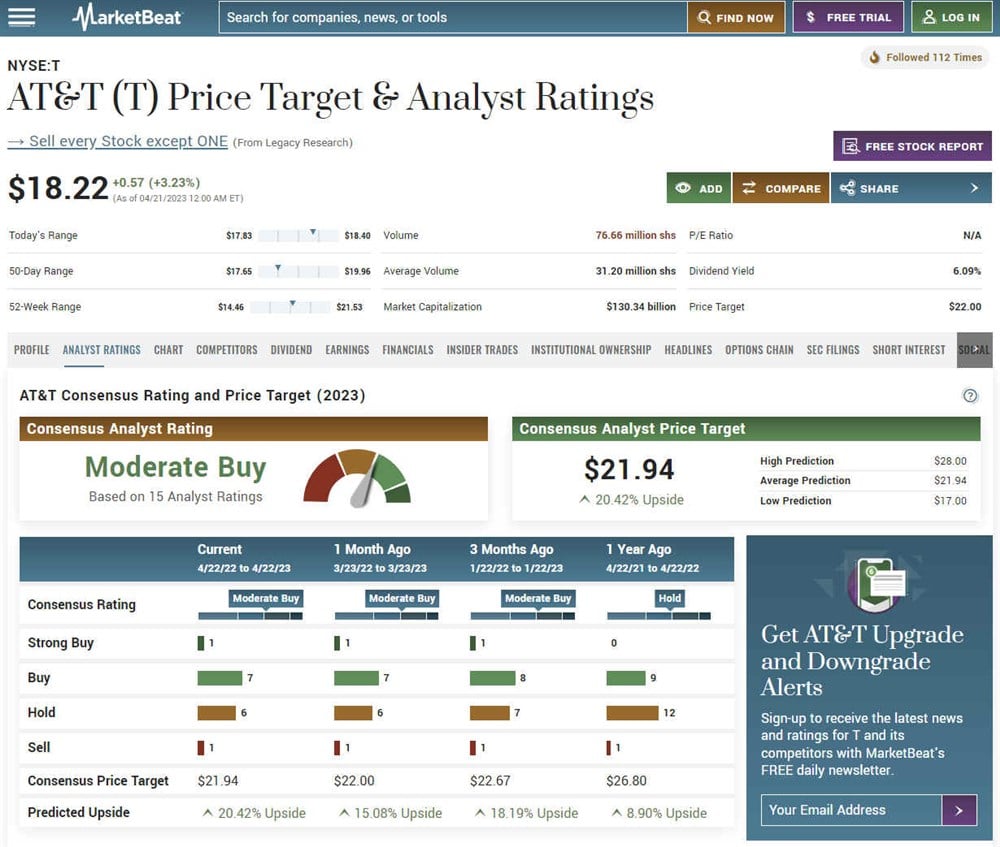
After the initial (10%) sell-off of its shares upon its earning release, HSBC upgraded shares of T to Buy from Hold and a $21 price target, explicitly noting the opportunity presented by the sell-off in shares. Analyst Adam Fox-Rumley commented, "At some point this year, subject to FCF generation, the market's attention should turn to falling CAPEX spend in 2024, a shrinking debt pile and, thereafter, the possibilities for buybacks.”
Many analysts are still concerned over AT&T’s large debt load of over $128 billion. AT&T analyst ratings and price targets can be found on MarketBeat.
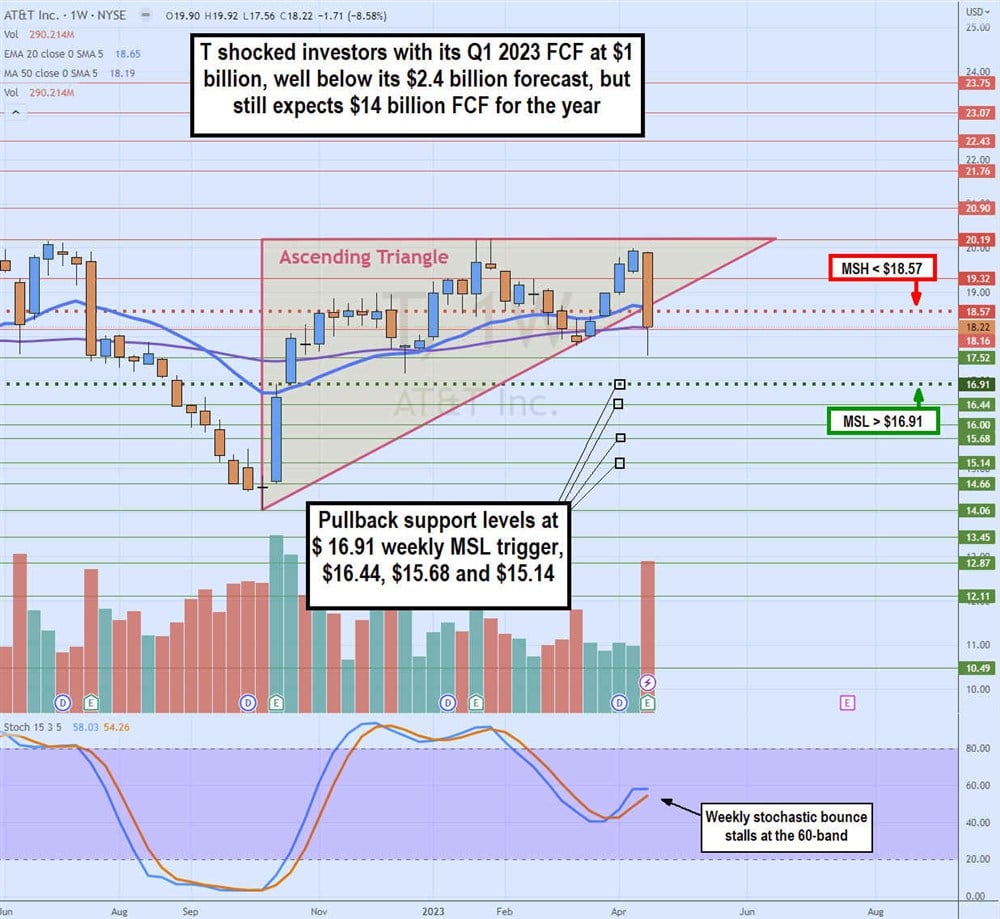
Weekly Ascending Triangle Potential Breakdown
The weekly candlestick chart on T has shown quite an excellent recovery off its October 2022 lows of $14.06, rising to $20.19 highs by January 2023 after triggering the weekly market structure low (MSL) breakout through $16.91. The Q1 2023 earnings sell-off triggered the weekly market structure high (MSH) sell trigger under $18.57 as shares attempted to hold the $17.52 level support. The weekly stochastic bounce has stalled at the 60-band. Pullback supports are at $16.91 weekly MSL trigger, $16.44, 15.68 and $15.14.


