Industrial equipment and engineered products manufacturer Albany (NYSE: AIN) met Wall Street’s revenue expectations in Q3 CY2024, with sales up 6.1% year on year to $298.4 million. On the other hand, the company’s full-year revenue guidance of $1.24 billion at the midpoint came in 1.3% below analysts’ estimates. Its GAAP profit of $0.57 per share was 37.7% above analysts’ consensus estimates.
Is now the time to buy Albany? Find out by accessing our full research report, it’s free.
Albany (AIN) Q3 CY2024 Highlights:
- Revenue: $298.4 million vs analyst estimates of $297.1 million (in line)
- EPS: $0.57 vs analyst estimates of $0.41 (37.7% beat)
- EBITDA: $53.55 million vs analyst estimates of $53.87 million (small miss)
- The company dropped its revenue guidance for the full year to $1.24 billion at the midpoint from $1.30 billion, a 4.2% decrease
- EBITDA guidance for the full year is $242 million at the midpoint, below analyst estimates of $247.7 million
- Gross Margin (GAAP): 30.3%, down from 36.7% in the same quarter last year
- Operating Margin: 8.4%, down from 14.3% in the same quarter last year
- EBITDA Margin: 17.9%, down from 23% in the same quarter last year
- Free Cash Flow Margin: 10.6%, down from 16.1% in the same quarter last year
- Market Capitalization: $2.24 billion
"I am pleased with the overall results of the quarter as we focused on operational excellence evidenced by strong results at Machine Clothing and Free Cash Flow generation of $78 million year-to-date. We are addressing the issues announced earlier this month, with specific emphasis on our Salt Lake Facility. Revenues of $298 million was up $17 million or 6.1% over prior year," said President and CEO, Gunnar Kleveland.
Company Overview
Founded in 1895, Albany (NYSE: AIN) is a global textiles and materials processing company, specializing in machine clothing for paper mills and engineered composite structures for aerospace and other industries.
General Industrial Machinery
Automation that increases efficiency and connected equipment that collects analyzable data have been trending, creating new demand for general industrial machinery companies. Those who innovate and create digitized solutions can spur sales and speed up replacement cycles, but all general industrial machinery companies are still at the whim of economic cycles. Consumer spending and interest rates, for example, can greatly impact the industrial production that drives demand for these companies’ offerings.
Sales Growth
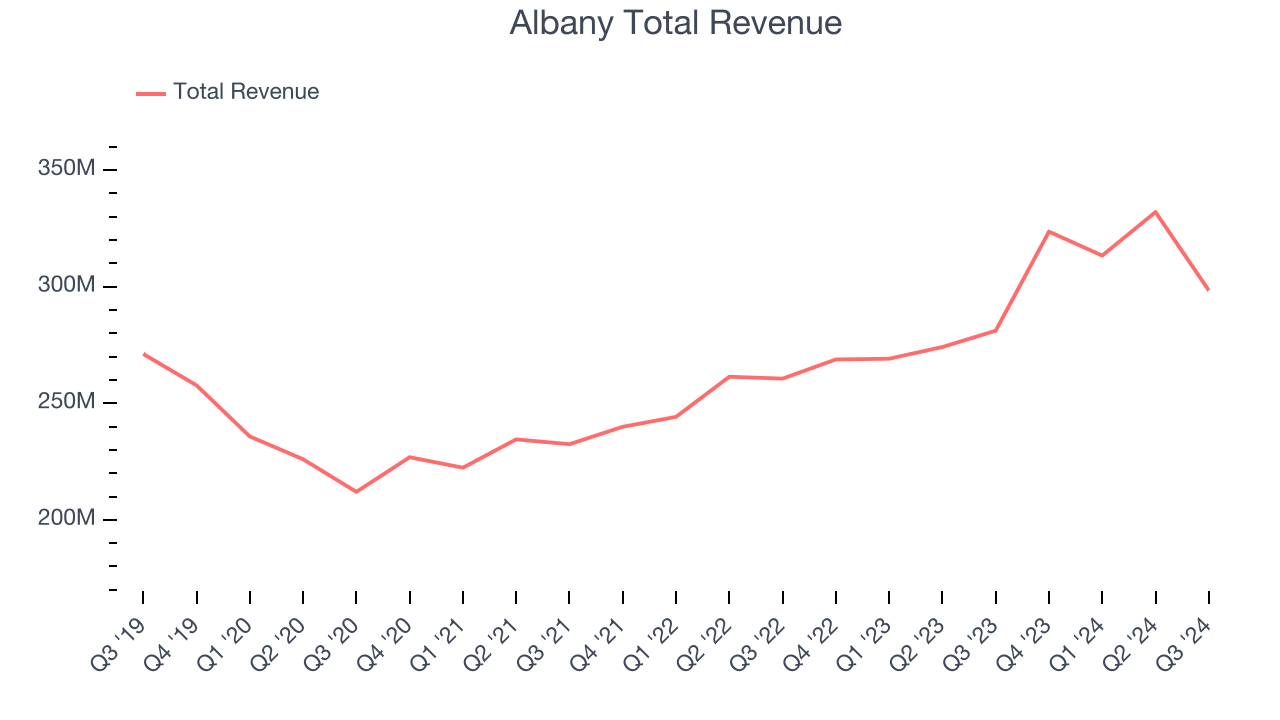
Examining a company’s long-term performance can provide clues about its business quality. Any business can put up a good quarter or two, but the best consistently grow over the long haul. Regrettably, Albany’s sales grew at a sluggish 3.5% compounded annual growth rate over the last five years. This shows it failed to expand in any major way, a rough starting point for our analysis.

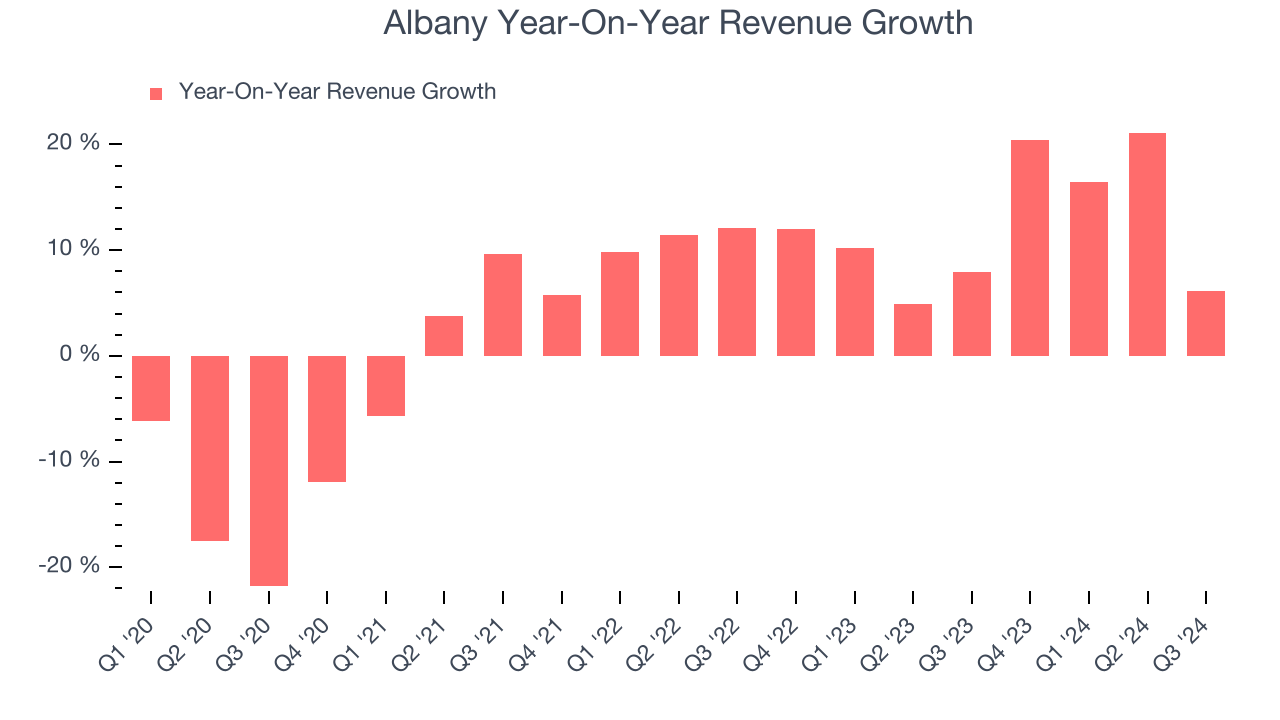
Long-term growth is the most important, but within industrials, a half-decade historical view may miss new industry trends or demand cycles. Albany’s annualized revenue growth of 12.2% over the last two years is above its five-year trend, suggesting its demand recently accelerated. 
We can better understand the company’s revenue dynamics by analyzing its most important segments, Machine Clothing and Engineered Composites, which are 61.3% and 38.7% of revenue. Over the last two years, Albany’s Machine Clothing revenue (paper manufacturing belts) averaged 11.1% year-on-year growth while its Engineered Composites revenue (aerospace components) averaged 15.7% growth.
This quarter, Albany grew its revenue by 6.1% year on year, and its $298.4 million of revenue was in line with Wall Street’s estimates.
Looking ahead, sell-side analysts expect revenue to grow 2.2% over the next 12 months, a deceleration versus the last two years. This projection doesn't excite us and illustrates the market thinks its products and services will see some demand headwinds.
When a company has more cash than it knows what to do with, buying back its own shares can make a lot of sense–as long as the price is right. Luckily, we’ve found one, a low-priced stock that is gushing free cash flow AND buying back shares. Click here to claim your Special Free Report on a fallen angel growth story that is already recovering from a setback.
Operating Margin
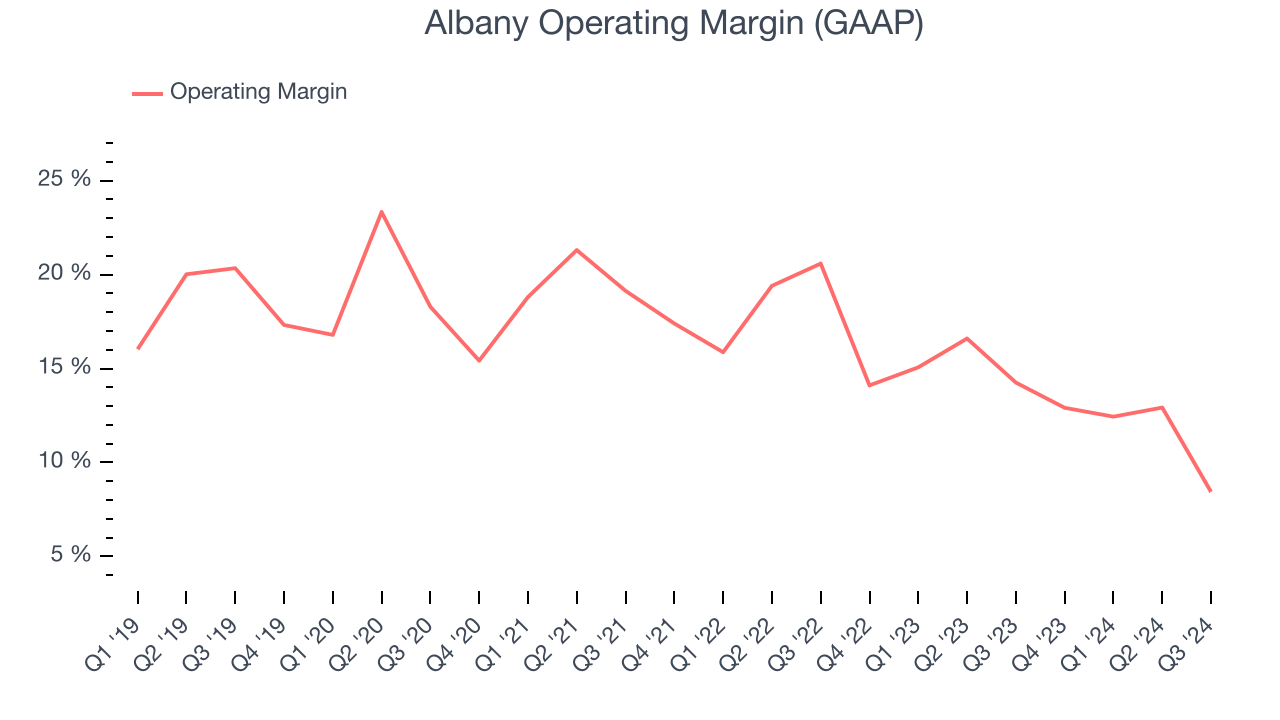
Albany has been a well-oiled machine over the last five years. It demonstrated elite profitability for an industrials business, boasting an average operating margin of 16.2%. This result isn’t surprising as its high gross margin gives it a favorable starting point.
Analyzing the trend in its profitability, Albany’s annual operating margin decreased by 7.1 percentage points over the last five years. Even though its margin is still high, shareholders will want to see Albany become more profitable in the future.

In Q3, Albany generated an operating profit margin of 8.4%, down 5.8 percentage points year on year. Since Albany’s gross margin decreased more than its operating margin, we can assume its recent inefficiencies were driven more by weaker leverage on its cost of sales rather than increased marketing, R&D, and administrative overhead expenses.
Earnings Per Share
Analyzing revenue trends tells us about a company’s historical growth, but the long-term change in its earnings per share (EPS) points to the profitability of that growth – for example, a company could inflate its sales through excessive spending on advertising and promotions.
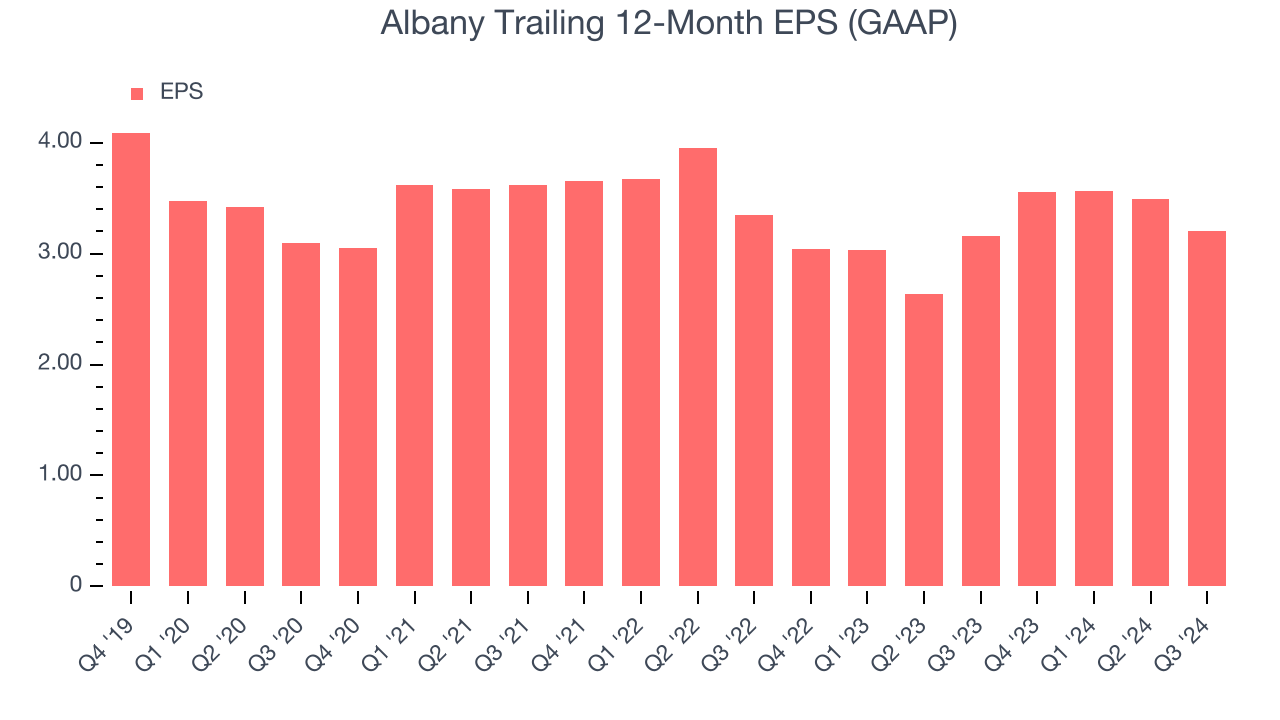
Sadly for Albany, its EPS declined by 6.9% annually over the last five years while its revenue grew by 3.5%. This tells us the company became less profitable on a per-share basis as it expanded.

We can take a deeper look into Albany’s earnings to better understand the drivers of its performance. As we mentioned earlier, Albany’s operating margin declined by 7.1 percentage points over the last five years. This was the most relevant factor (aside from the revenue impact) behind its lower earnings; taxes and interest expenses can also affect EPS but don’t tell us as much about a company’s fundamentals.
Like with revenue, we analyze EPS over a shorter period to see if we are missing a change in the business.
For Albany, its two-year annual EPS declines of 2.2% show it’s still underperforming. These results were bad no matter how you slice the data.In Q3, Albany reported EPS at $0.57, down from $0.87 in the same quarter last year. Despite falling year on year, this print easily cleared analysts’ estimates. Over the next 12 months, Wall Street expects Albany’s full-year EPS of $3.20 to grow by 17.6%.
Key Takeaways from Albany’s Q3 Results
We were impressed by how significantly Albany blew past analysts’ EPS expectations this quarter. We were also glad its revenue outperformed Wall Street’s estimates. On the other hand, its EBITDA forecast for the full year missed and its Machine Clothing revenue fell short Wall Street’s estimates. Overall, this quarter was mixed, with something for the bulls and something for the bears. The stock traded up 1.2% to $71.58 immediately following the results.
Big picture, is Albany a buy here and now? What happened in the latest quarter matters, but not as much as longer-term business quality and valuation, when deciding whether to invest in this stock. We cover that in our actionable full research report which you can read here, it’s free.


