

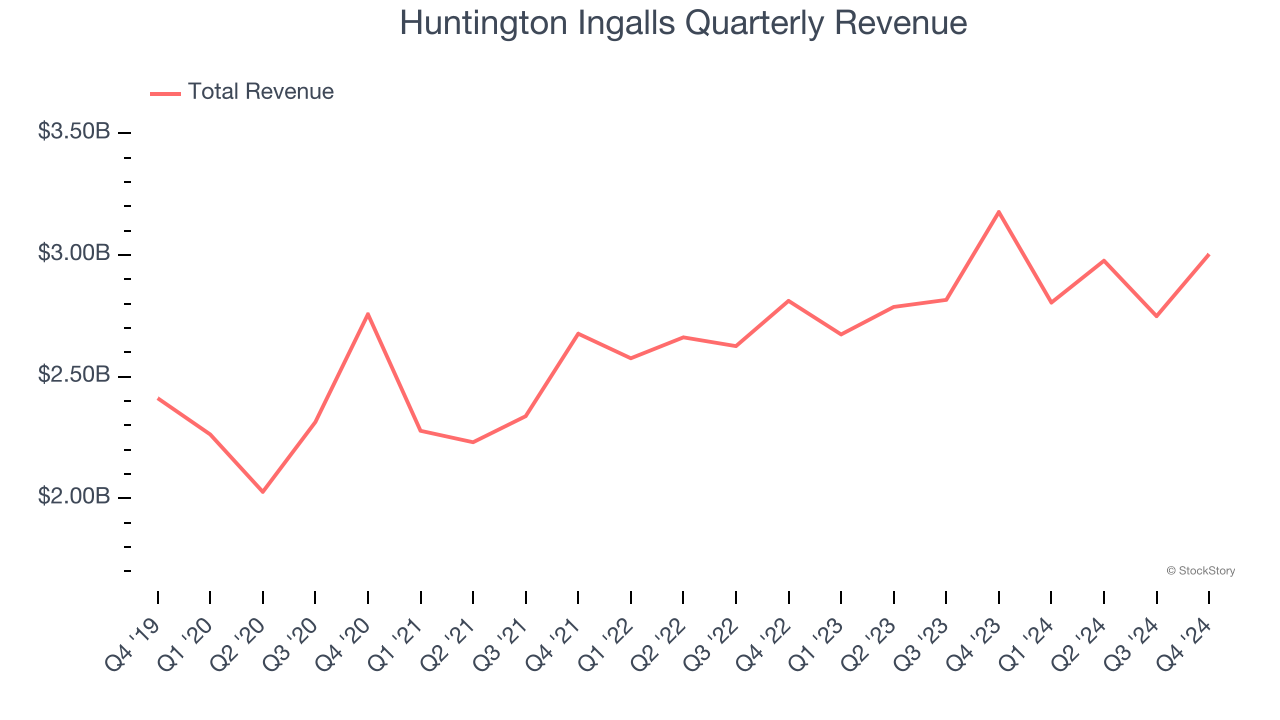
Aerospace and defense company Huntington Ingalls (NYSE: HII) missed Wall Street’s revenue expectations in Q4 CY2024, with sales falling 5.4% year on year to $3.00 billion. Its GAAP profit of $3.15 per share was 10.8% below analysts’ consensus estimates.
Is now the time to buy Huntington Ingalls? Find out by accessing our full research report, it’s free.
Huntington Ingalls (HII) Q4 CY2024 Highlights:
- Revenue: $3.00 billion vs analyst estimates of $3.06 billion (5.4% year-on-year decline, 1.8% miss)
- EPS (GAAP): $3.15 vs analyst expectations of $3.53 (10.8% miss)
- Operating Margin: 3.7%, down from 9.8% in the same quarter last year
- Free Cash Flow Margin: 9.2%, down from 13.7% in the same quarter last year
- Backlog: $48.7 billion at quarter end, up 1.2% year on year
- Market Capitalization: $7.65 billion
Chris Kastner, HII’s president and CEO, said, “We continue to make progress on ships put under contract pre-COVID, and are working diligently with our customers to put over $50 billion of new work under contract. Mission Technologies continued its strong track record of top line growth and margin expansion and secured an impressive $12 billion in total future contract value during 2024. We enter 2025 focused on our mission to deliver the world’s most powerful ships and all-domain solutions in service of the nation.”
Company Overview
Building Nimitz-class aircraft carriers used in active service, Huntington Ingalls (NYSE: HII) develops marine vessels and their mission systems and maintenance services.
Defense Contractors
Defense contractors typically require technical expertise and government clearance. Companies in this sector can also enjoy long-term contracts with government bodies, leading to more predictable revenues. Combined, these factors create high barriers to entry and can lead to limited competition. Lately, geopolitical tensions–whether it be Russia’s invasion of Ukraine or China’s aggression towards Taiwan–highlight the need for defense spending. On the other hand, demand for these products can ebb and flow with defense budgets and even who is president, as different administrations can have vastly different ideas of how to allocate federal funds.
Sales Growth
A company’s long-term performance is an indicator of its overall quality. While any business can experience short-term success, top-performing ones enjoy sustained growth for years. Regrettably, Huntington Ingalls’s sales grew at a tepid 5.3% compounded annual growth rate over the last five years. This fell short of our benchmark for the industrials sector and is a rough starting point for our analysis.
Long-term growth is the most important, but within industrials, a half-decade historical view may miss new industry trends or demand cycles. Huntington Ingalls’s recent history shows its demand slowed as its annualized revenue growth of 3.9% over the last two years is below its five-year trend. 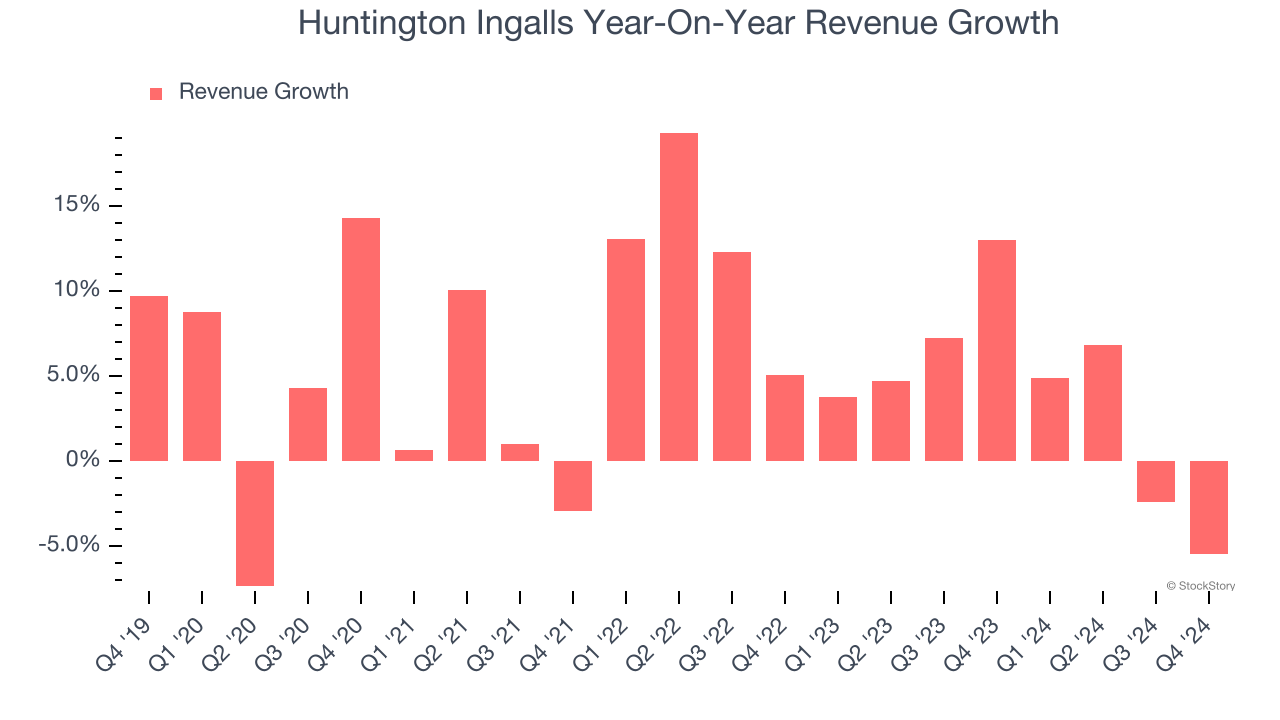
Huntington Ingalls also reports its backlog, or the value of its outstanding orders that have not yet been executed or delivered. Huntington Ingalls’s backlog reached $48.7 billion in the latest quarter and averaged 1.6% year-on-year growth over the last two years. Because this number is lower than its revenue growth, we can see the company hasn’t secured enough new orders to maintain its growth rate in the future. 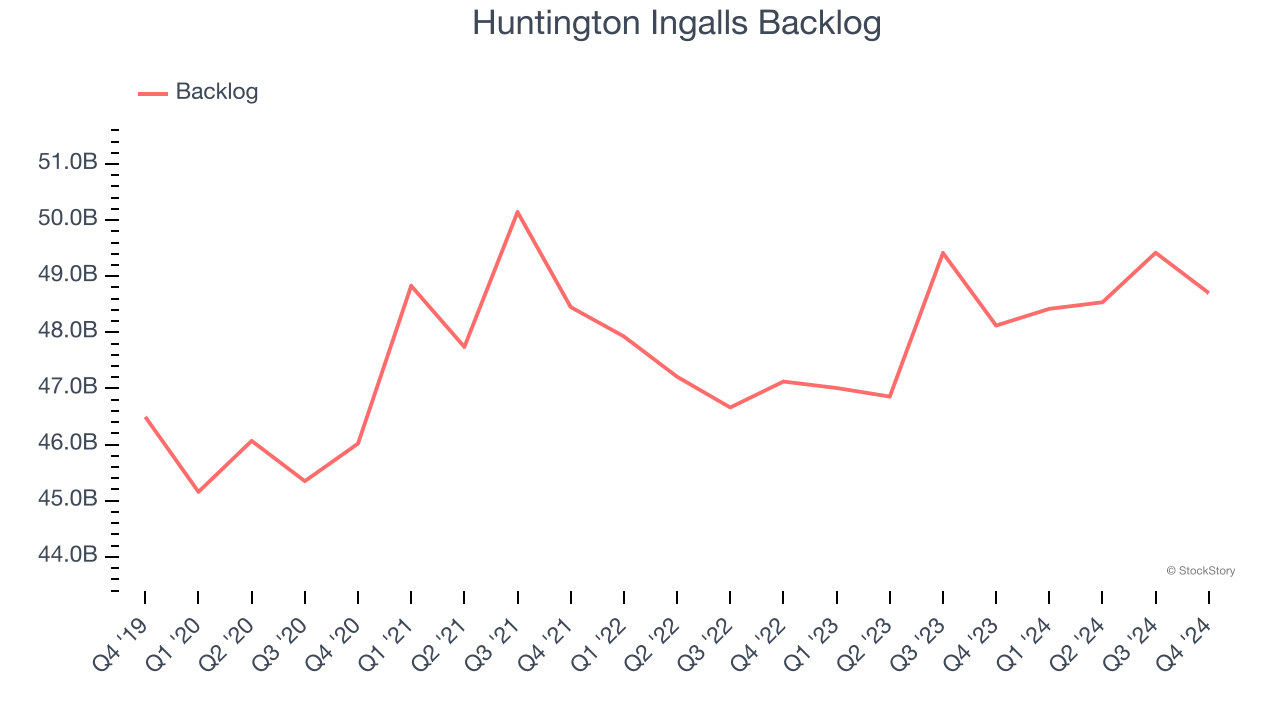
This quarter, Huntington Ingalls missed Wall Street’s estimates and reported a rather uninspiring 5.4% year-on-year revenue decline, generating $3.00 billion of revenue.
Looking ahead, sell-side analysts expect revenue to grow 4.1% over the next 12 months, similar to its two-year rate. This projection is underwhelming and suggests its newer products and services will not catalyze better top-line performance yet.
Software is eating the world and there is virtually no industry left that has been untouched by it. That drives increasing demand for tools helping software developers do their jobs, whether it be monitoring critical cloud infrastructure, integrating audio and video functionality, or ensuring smooth content streaming. Click here to access a free report on our 3 favorite stocks to play this generational megatrend.
Operating Margin
Operating margin is one of the best measures of profitability because it tells us how much money a company takes home after procuring and manufacturing its products, marketing and selling those products, and most importantly, keeping them relevant through research and development.
Huntington Ingalls was profitable over the last five years but held back by its large cost base. Its average operating margin of 6.1% was weak for an industrials business.
Looking at the trend in its profitability, Huntington Ingalls’s operating margin decreased by 3.9 percentage points over the last five years. The company’s performance was poor no matter how you look at it - it shows operating expenses were rising and it couldn’t pass those costs onto its customers.
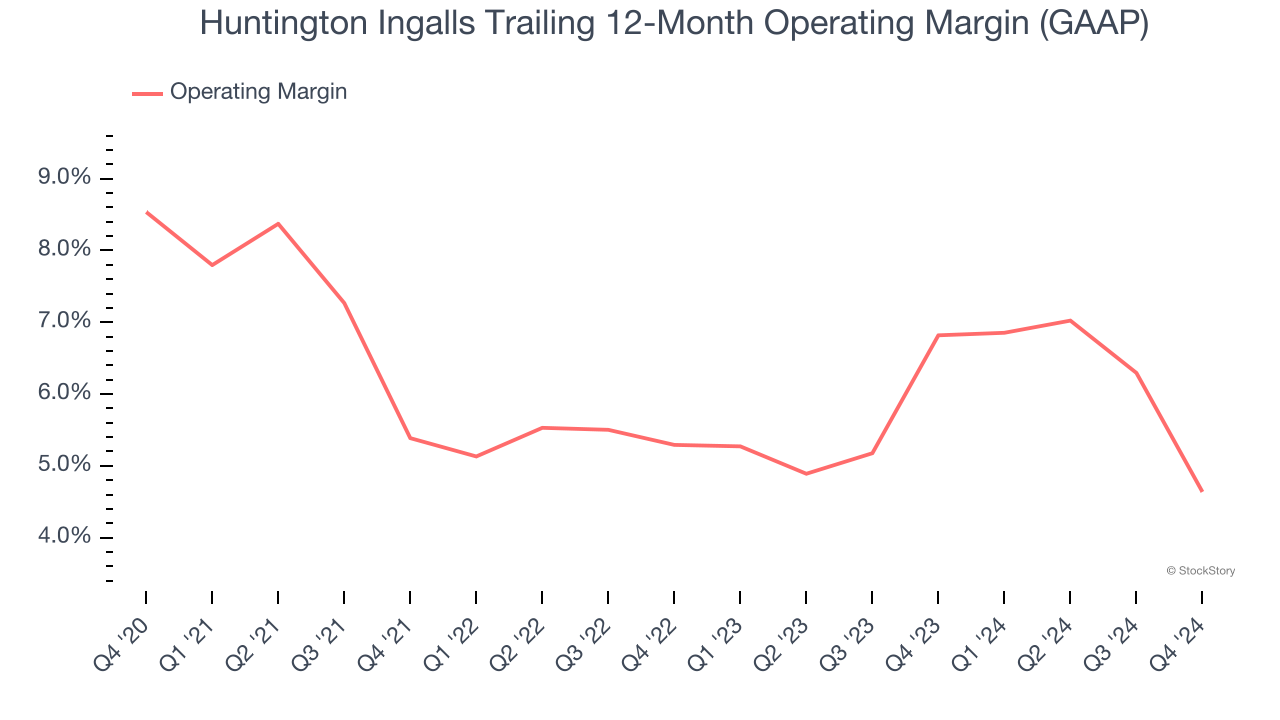
This quarter, Huntington Ingalls generated an operating profit margin of 3.7%, down 6.2 percentage points year on year. This contraction shows it was recently less efficient because its expenses increased relative to its revenue.
Earnings Per Share
We track the long-term change in earnings per share (EPS) for the same reason as long-term revenue growth. Compared to revenue, however, EPS highlights whether a company’s growth is profitable.
Huntington Ingalls’s EPS grew at a weak 1% compounded annual growth rate over the last five years, lower than its 5.3% annualized revenue growth. This tells us the company became less profitable on a per-share basis as it expanded due to non-fundamental factors such as interest expenses and taxes.
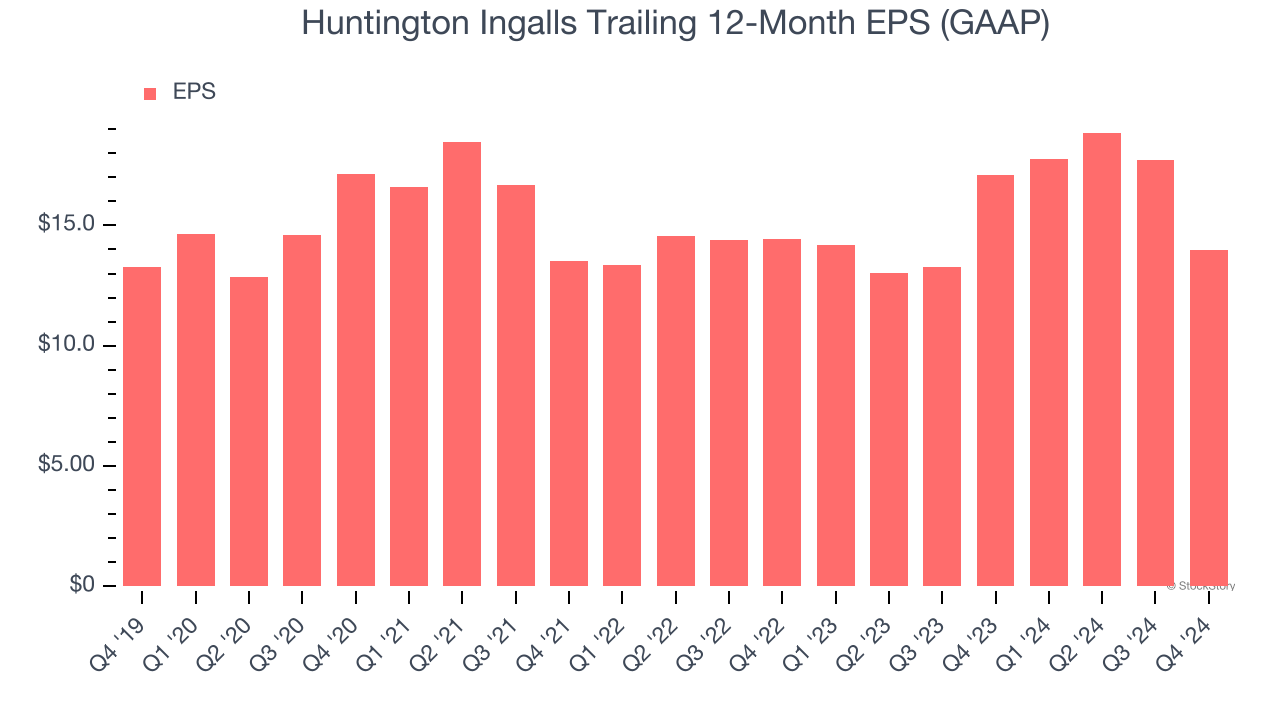
We can take a deeper look into Huntington Ingalls’s earnings to better understand the drivers of its performance. As we mentioned earlier, Huntington Ingalls’s operating margin declined by 3.9 percentage points over the last five years. This was the most relevant factor (aside from the revenue impact) behind its lower earnings; taxes and interest expenses can also affect EPS but don’t tell us as much about a company’s fundamentals.
Like with revenue, we analyze EPS over a shorter period to see if we are missing a change in the business.
For Huntington Ingalls, its two-year annual EPS declines of 1.7% show it’s continued to underperform. These results were bad no matter how you slice the data.
In Q4, Huntington Ingalls reported EPS at $3.15, down from $6.90 in the same quarter last year. This print missed analysts’ estimates. Over the next 12 months, Wall Street expects Huntington Ingalls’s full-year EPS of $13.96 to grow 8%.
Key Takeaways from Huntington Ingalls’s Q4 Results
We struggled to find many positives in these results. Its EPS missed significantly and its revenue fell short of Wall Street’s estimates. Overall, this quarter could have been better. The stock traded down 10.7% to $174.85 immediately after reporting.
Huntington Ingalls didn’t show it’s best hand this quarter, but does that create an opportunity to buy the stock right now? We think that the latest quarter is only one piece of the longer-term business quality puzzle. Quality, when combined with valuation, can help determine if the stock is a buy. We cover that in our actionable full research report which you can read here, it’s free.


