

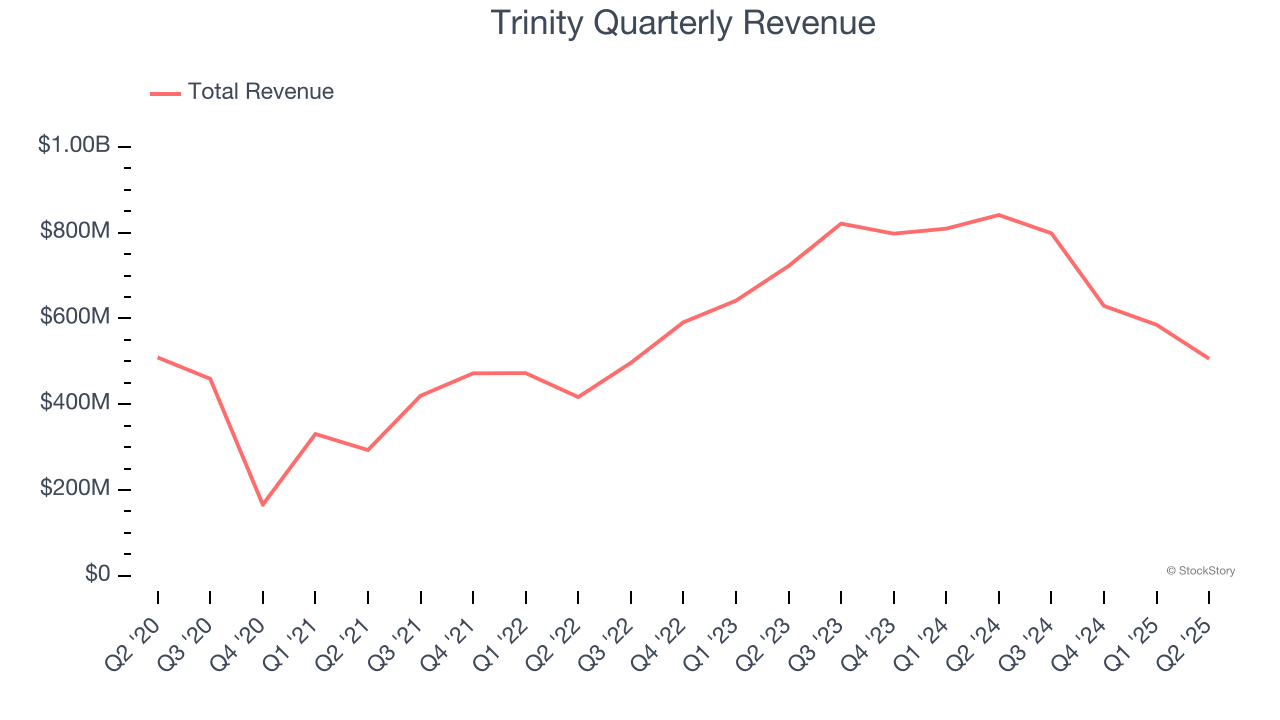
Railcar products and services provider Trinity (NYSE: TRN) fell short of the market’s revenue expectations in Q2 CY2025, with sales falling 39.8% year on year to $506.2 million. Its GAAP profit of $0.17 per share was 37% below analysts’ consensus estimates.
Is now the time to buy Trinity? Find out by accessing our full research report, it’s free.
Trinity (TRN) Q2 CY2025 Highlights:
- Revenue: $506.2 million vs analyst estimates of $583.5 million (39.8% year-on-year decline, 13.3% miss)
- EPS (GAAP): $0.17 vs analyst expectations of $0.27 (37% miss)
- Adjusted EBITDA: $171.7 million vs analyst estimates of $177 million (33.9% margin, 3% miss)
- EPS (GAAP) guidance for the full year is $1.50 at the midpoint, beating analyst estimates by 15.4%
- Operating Margin: 18.8%, up from 14% in the same quarter last year
- Free Cash Flow was -$122.6 million, down from $145 million in the same quarter last year
- Market Capitalization: $2.04 billion
“Our second quarter results highlight the robust performance of our leasing business and Trinity’s capability to generate substantial cash flow,” stated Trinity’s Chief Executive Officer and President, Jean Savage.
Company Overview
Operating under the trade name TrinityRail, Trinity (NYSE: TRN) is a provider of railcar products and services in North America.
Revenue Growth
A company’s long-term sales performance is one signal of its overall quality. Any business can put up a good quarter or two, but many enduring ones grow for years. Trinity’s demand was weak over the last five years as its sales fell at a 2% annual rate. This was below our standards and suggests it’s a low quality business.
Long-term growth is the most important, but within industrials, a half-decade historical view may miss new industry trends or demand cycles. Trinity’s annualized revenue growth of 1.4% over the last two years is above its five-year trend, but we were still disappointed by the results. We also note many other Heavy Transportation Equipment businesses have faced declining sales because of cyclical headwinds. While Trinity grew slower than we’d like, it did do better than its peers. 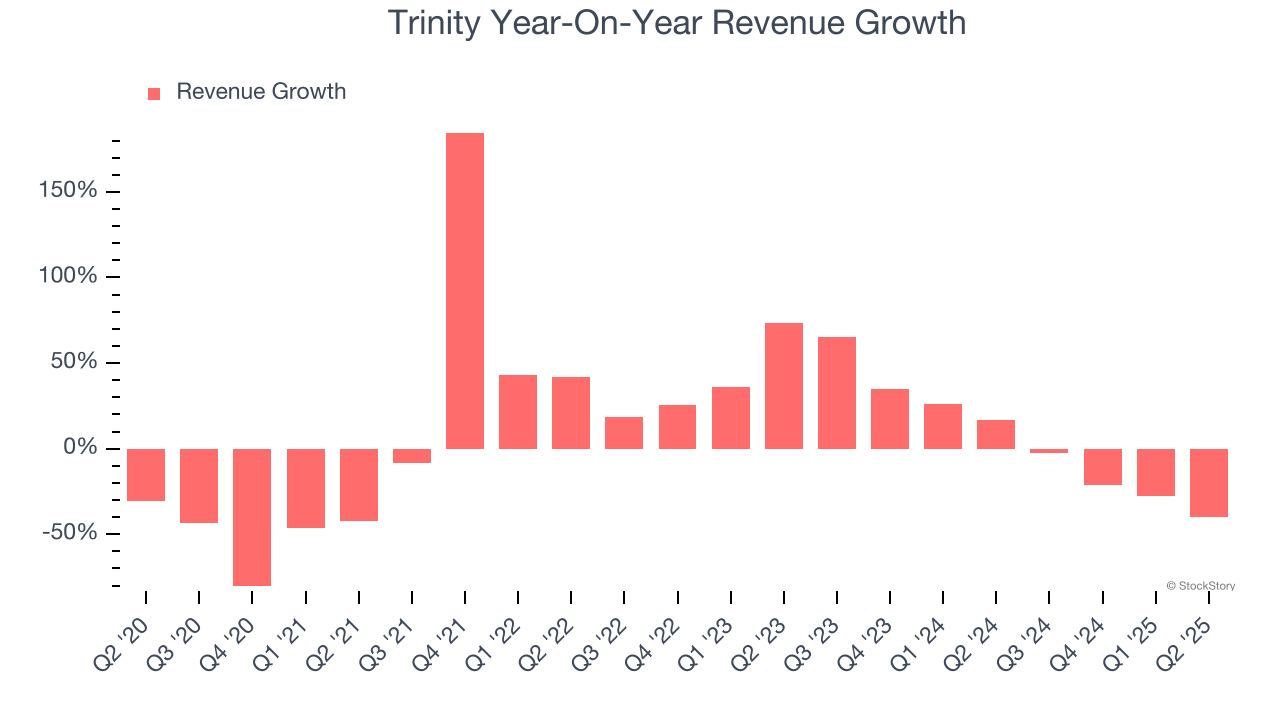
This quarter, Trinity missed Wall Street’s estimates and reported a rather uninspiring 39.8% year-on-year revenue decline, generating $506.2 million of revenue.
Looking ahead, sell-side analysts expect revenue to decline by 18.5% over the next 12 months, a deceleration versus the last two years. This projection is underwhelming and indicates its products and services will face some demand challenges.
Today’s young investors won’t have read the timeless lessons in Gorilla Game: Picking Winners In High Technology because it was written more than 20 years ago when Microsoft and Apple were first establishing their supremacy. But if we apply the same principles, then enterprise software stocks leveraging their own generative AI capabilities may well be the Gorillas of the future. So, in that spirit, we are excited to present our Special Free Report on a profitable, fast-growing enterprise software stock that is already riding the automation wave and looking to catch the generative AI next.
Operating Margin
Trinity’s operating margin has risen over the last 12 months and averaged 12.5% over the last five years. On top of that, its profitability was top-notch for an industrials business, showing it’s an well-run company with an efficient cost structure. This result was particularly impressive because of its low gross margin, which is mostly a factor of what it sells and takes huge shifts to move meaningfully. Companies have more control over their operating margins, and it’s a show of well-managed operations if they’re high when gross margins are low.
Looking at the trend in its profitability, Trinity’s operating margin might fluctuated slightly but has generally stayed the same over the last five years, highlighting the consistency of its expense base.
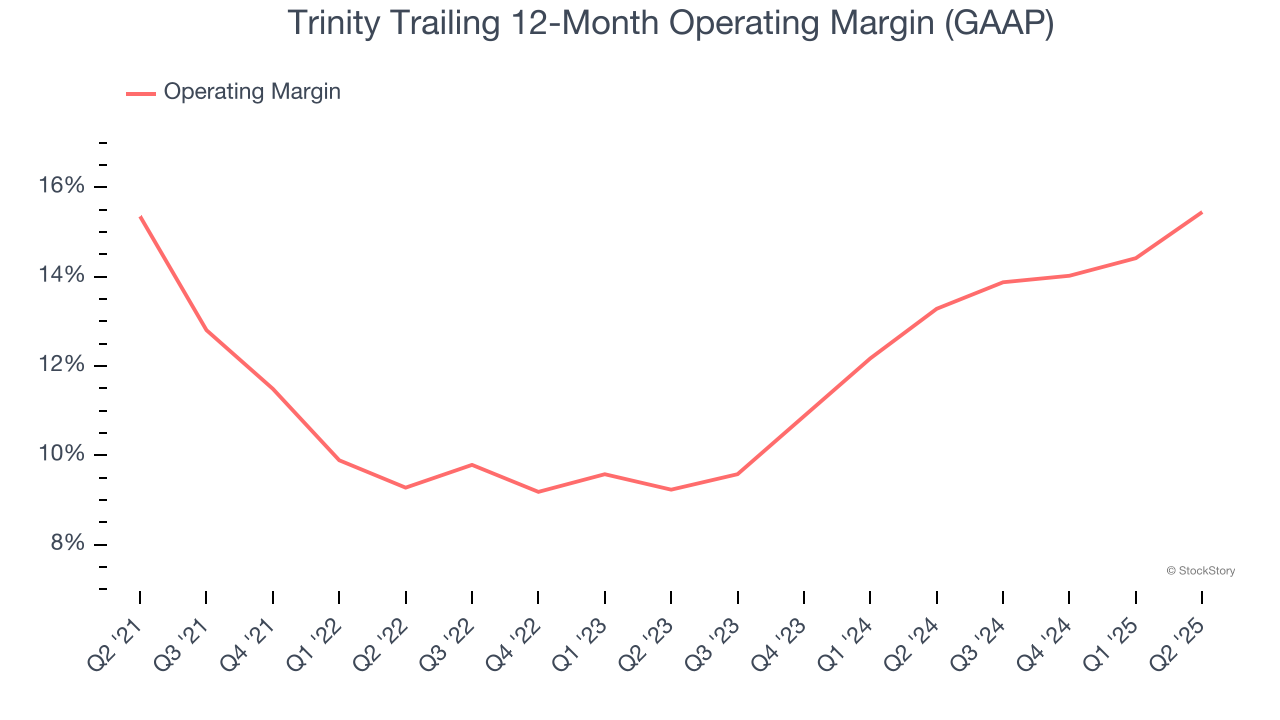
This quarter, Trinity generated an operating margin profit margin of 18.8%, up 4.9 percentage points year on year. Since its gross margin expanded more than its operating margin, we can infer that leverage on its cost of sales was the primary driver behind the recently higher efficiency.
Earnings Per Share
We track the long-term change in earnings per share (EPS) for the same reason as long-term revenue growth. Compared to revenue, however, EPS highlights whether a company’s growth is profitable.
Trinity’s EPS grew at an astounding 55.2% compounded annual growth rate over the last five years, higher than its 2% annualized revenue declines. This tells us management adapted its cost structure in response to a challenging demand environment.
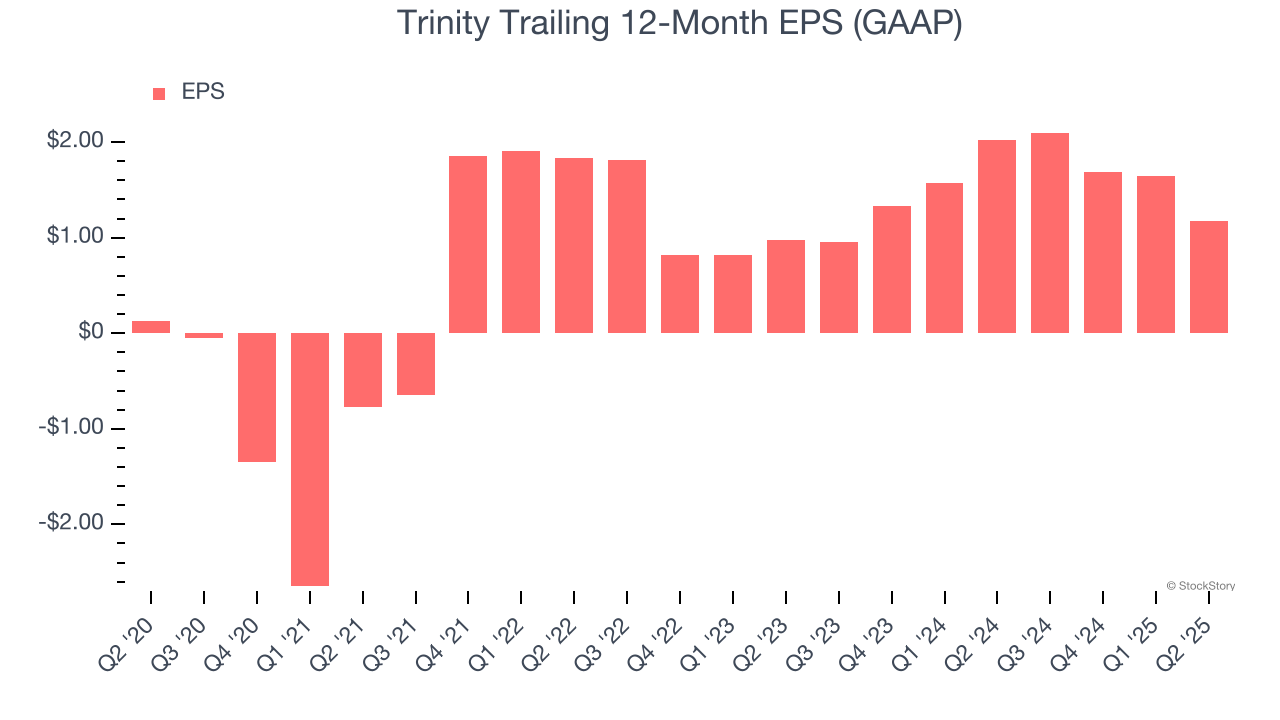
Diving into Trinity’s quality of earnings can give us a better understanding of its performance. A five-year view shows that Trinity has repurchased its stock, shrinking its share count by 29.3%. This tells us its EPS outperformed its revenue not because of increased operational efficiency but financial engineering, as buybacks boost per share earnings. 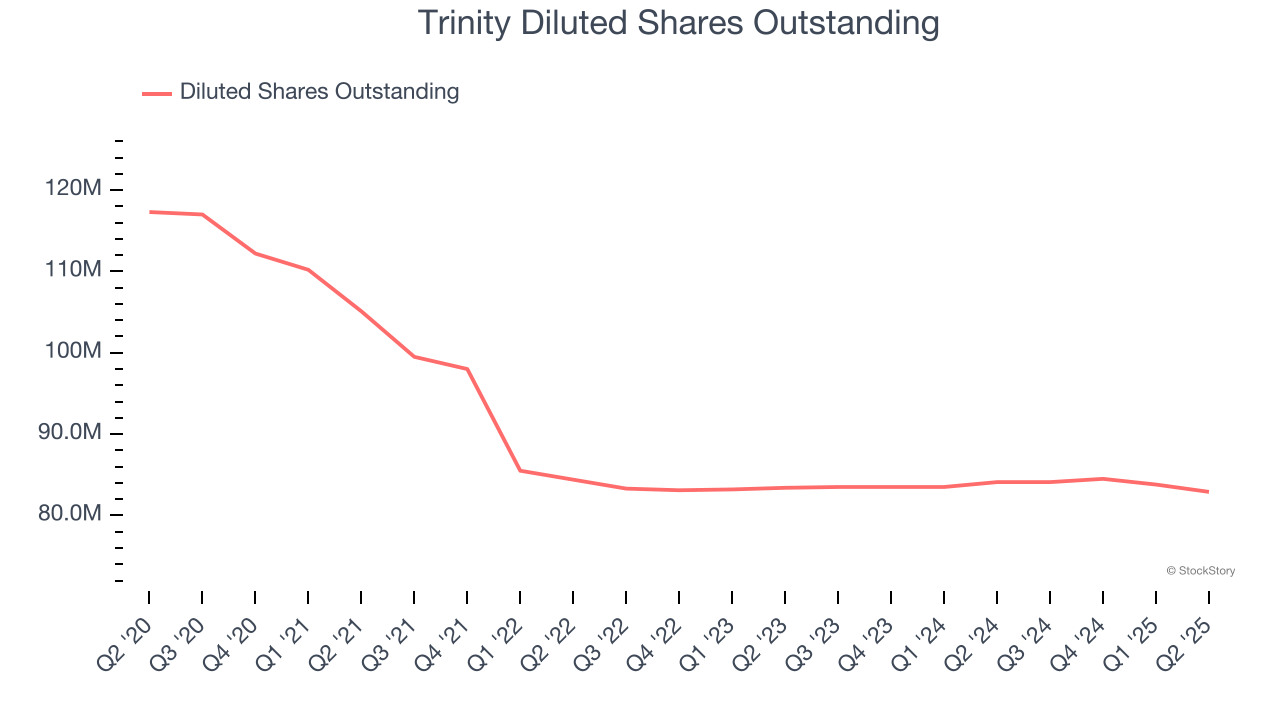
Like with revenue, we analyze EPS over a shorter period to see if we are missing a change in the business.
For Trinity, its two-year annual EPS growth of 9.3% was lower than its five-year trend. We hope its growth can accelerate in the future.
In Q2, Trinity reported EPS at $0.17, down from $0.65 in the same quarter last year. This print missed analysts’ estimates, but we care more about long-term EPS growth than short-term movements. We also like to analyze expected EPS growth based on Wall Street analysts’ consensus projections, but there is insufficient data.
Key Takeaways from Trinity’s Q2 Results
We were impressed by Trinity’s optimistic full-year EPS guidance, which blew past analysts’ expectations. On the other hand, its revenue missed and its EPS fell short of Wall Street’s estimates. Overall, this was a softer quarter. The stock traded down 4% to $24 immediately following the results.
Trinity’s latest earnings report disappointed. One quarter doesn’t define a company’s quality, so let’s explore whether the stock is a buy at the current price. The latest quarter does matter, but not nearly as much as longer-term fundamentals and valuation, when deciding if the stock is a buy. We cover that in our actionable full research report which you can read here, it’s free.


