

Freight delivery company XPO (NYSE: XPO) beat Wall Street’s revenue expectations in Q2 CY2025, but sales were flat year on year at $2.08 billion. Its non-GAAP profit of $1.05 per share was 6.2% above analysts’ consensus estimates.
Is now the time to buy XPO? Find out by accessing our full research report, it’s free.
XPO (XPO) Q2 CY2025 Highlights:
- Revenue: $2.08 billion vs analyst estimates of $2.05 billion (flat year on year, 1.6% beat)
- Adjusted EPS: $1.05 vs analyst estimates of $0.99 (6.2% beat)
- Adjusted EBITDA: $340 million vs analyst estimates of $331.5 million (16.3% margin, 2.6% beat)
- Operating Margin: 9.5%, in line with the same quarter last year
- Free Cash Flow Margin: 2.1%, similar to the same quarter last year
- Market Capitalization: $15.58 billion
Company Overview
Owning a mobile game simulating freight operations for the Tour de France, XPO (NYSE: XPO) is a transportation company specializing in expedited shipping services.
Revenue Growth
A company’s long-term sales performance is one signal of its overall quality. Any business can put up a good quarter or two, but many enduring ones grow for years. Over the last five years, XPO’s demand was weak and its revenue declined by 6.5% per year. This was below our standards and is a sign of poor business quality.
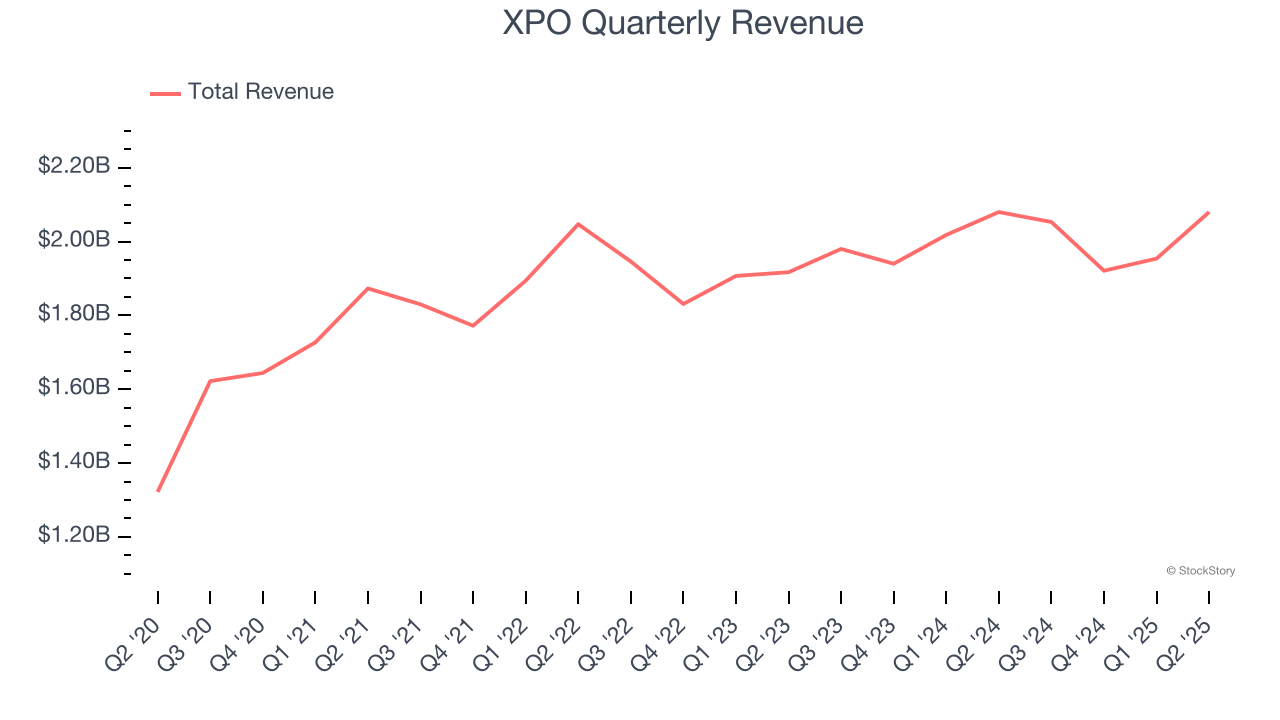
Long-term growth is the most important, but within industrials, a half-decade historical view may miss new industry trends or demand cycles. XPO’s annualized revenue growth of 2.6% over the last two years is above its five-year trend, but we were still disappointed by the results. We also note many other Ground Transportation businesses have faced declining sales because of cyclical headwinds. While XPO grew slower than we’d like, it did do better than its peers. 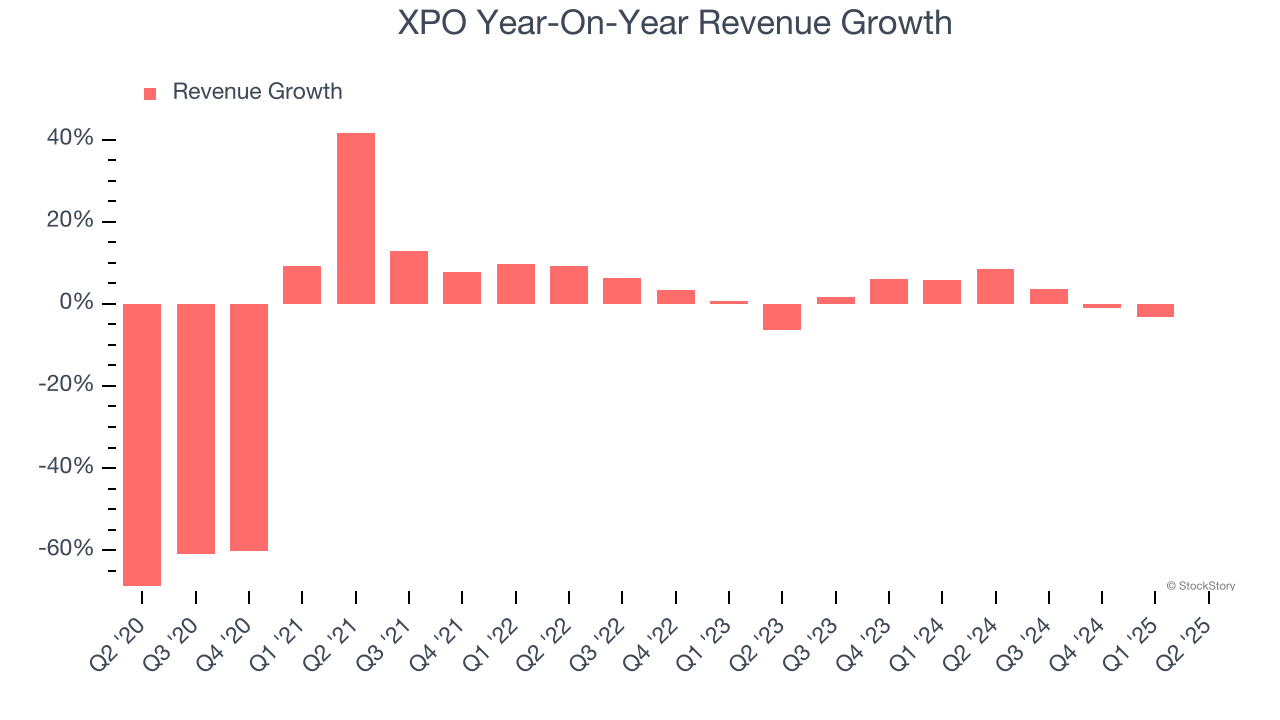
We can dig further into the company’s revenue dynamics by analyzing its most important segments, North American Less-Than-Truckload and European Transportation , which are 59.6% and 40.4% of revenue. Over the last two years, XPO’s North American Less-Than-Truckload revenue (freight services) averaged 3% year-on-year growth while its European Transportation revenue (truckload, less-than-truckload, and truck brokerage) averaged 2.4% growth.
This quarter, XPO’s $2.08 billion of revenue was flat year on year but beat Wall Street’s estimates by 1.6%.
Looking ahead, sell-side analysts expect revenue to grow 2.3% over the next 12 months, similar to its two-year rate. This projection is underwhelming and implies its newer products and services will not lead to better top-line performance yet.
Unless you’ve been living under a rock, it should be obvious by now that generative AI is going to have a huge impact on how large corporations do business. While Nvidia and AMD are trading close to all-time highs, we prefer a lesser-known (but still profitable) stock benefiting from the rise of AI. Click here to access our free report one of our favorites growth stories.
Operating Margin
Operating margin is an important measure of profitability as it shows the portion of revenue left after accounting for all core expenses – everything from the cost of goods sold to advertising and wages. It’s also useful for comparing profitability across companies with different levels of debt and tax rates because it excludes interest and taxes.
XPO was profitable over the last five years but held back by its large cost base. Its average operating margin of 6.1% was weak for an industrials business. This result isn’t too surprising given its low gross margin as a starting point.
On the plus side, XPO’s operating margin rose by 3.4 percentage points over the last five years. We’ll take XPO’s improvement as many Ground Transportation companies saw their margins fall (along with revenue, as mentioned above) because the cycle turned in the wrong direction.
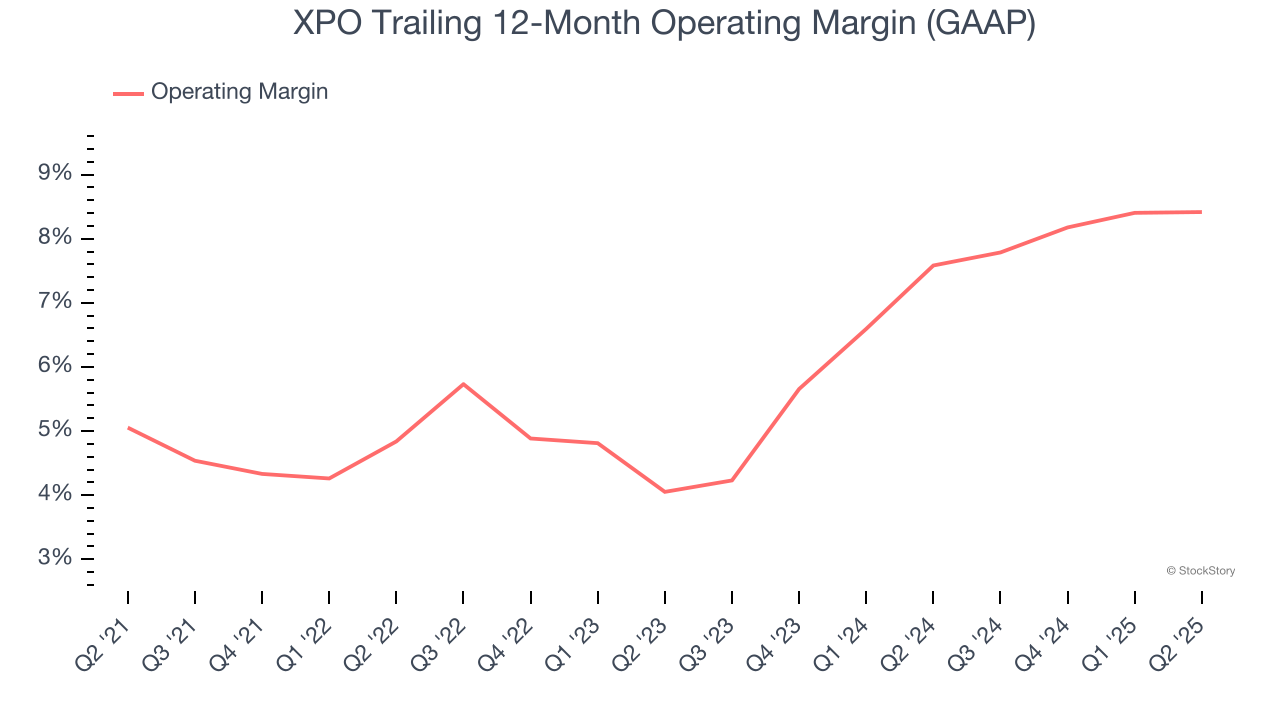
This quarter, XPO generated an operating margin profit margin of 9.5%, in line with the same quarter last year. This indicates the company’s cost structure has recently been stable.
Earnings Per Share
We track the long-term change in earnings per share (EPS) for the same reason as long-term revenue growth. Compared to revenue, however, EPS highlights whether a company’s growth is profitable.
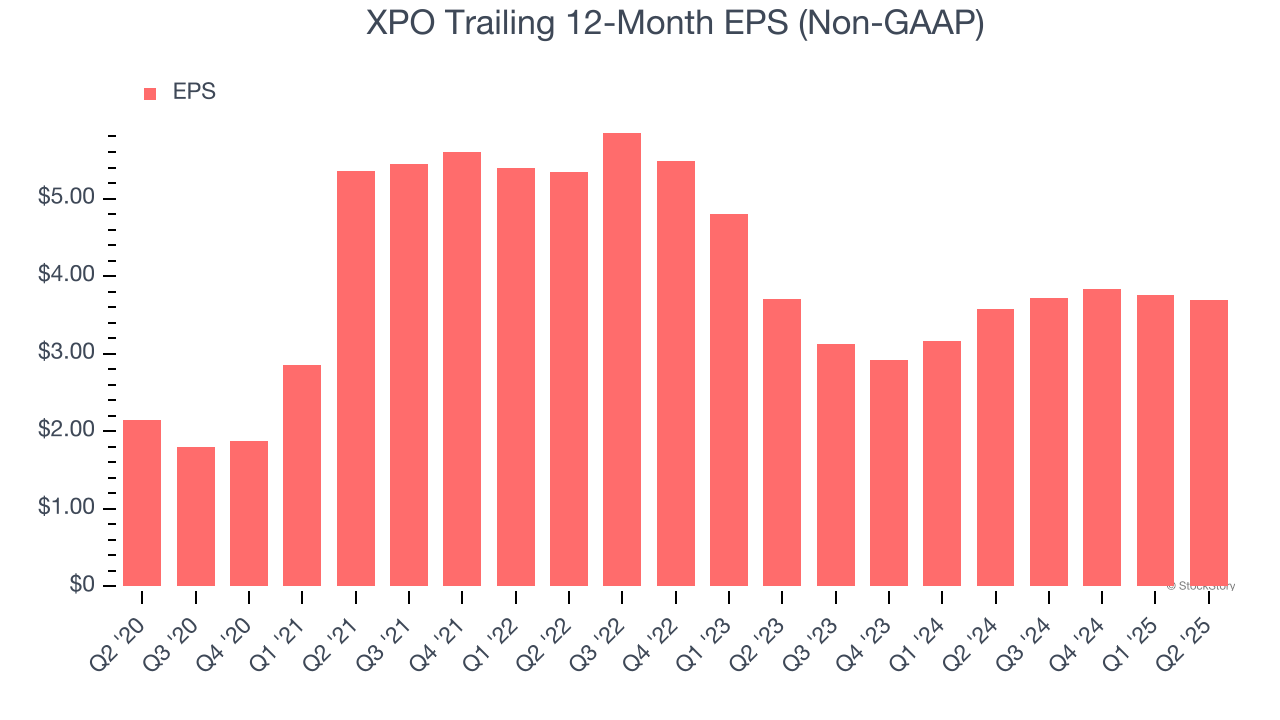
XPO’s EPS grew at a solid 11.5% compounded annual growth rate over the last five years, higher than its 6.5% annualized revenue declines. This tells us management adapted its cost structure in response to a challenging demand environment.
Diving into the nuances of XPO’s earnings can give us a better understanding of its performance. As we mentioned earlier, XPO’s operating margin was flat this quarter but expanded by 3.4 percentage points over the last five years. This was the most relevant factor (aside from the revenue impact) behind its higher earnings; interest expenses and taxes can also affect EPS but don’t tell us as much about a company’s fundamentals.
Like with revenue, we analyze EPS over a more recent period because it can provide insight into an emerging theme or development for the business.
For XPO, EPS didn’t budge over the last two years, a regression from its five-year trend. We hope it can revert to earnings growth in the coming years.
In Q2, XPO reported adjusted EPS at $1.05, down from $1.12 in the same quarter last year. Despite falling year on year, this print beat analysts’ estimates by 6.2%. Over the next 12 months, Wall Street expects XPO’s full-year EPS of $3.69 to grow 10.2%.
Key Takeaways from XPO’s Q2 Results
We enjoyed seeing XPO exceed analysts’ European Transportation revenue expectations this quarter. We were also happy its EPS and EBITDA outperformed Wall Street’s estimates. Overall, we think this was a solid quarter with some key areas of upside. The stock remained flat at $132.99 immediately after reporting.
XPO put up rock-solid earnings, but one quarter doesn’t necessarily make the stock a buy. Let’s see if this is a good investment. The latest quarter does matter, but not nearly as much as longer-term fundamentals and valuation, when deciding if the stock is a buy. We cover that in our actionable full research report which you can read here, it’s free.


