Industrial supplies company MSC Industrial Direct (NYSE: MSM) met Wall Streets revenue expectations in Q4 CY2025, with sales up 4% year on year to $965.7 million. Its non-GAAP profit of $0.99 per share was 4.8% above analysts’ consensus estimates.
Is now the time to buy MSC Industrial? Find out by accessing our full research report, it’s free for active Edge members.
MSC Industrial (MSM) Q4 CY2025 Highlights:
- Revenue: $965.7 million vs analyst estimates of $962.5 million (4% year-on-year growth, in line)
- Adjusted EPS: $0.99 vs analyst estimates of $0.95 (4.8% beat)
- Adjusted EBITDA: $105.7 million vs analyst estimates of $102.5 million (10.9% margin, 3.1% beat)
- Operating Margin: 7.9%, in line with the same quarter last year
- Free Cash Flow Margin: 0.8%, down from 8.8% in the same quarter last year
- Market Capitalization: $4.74 billion
Company Overview
Founded in NYC’s Little Italy, MSC Industrial Direct (NYSE: MSM) provides industrial supplies and equipment, offering vast and reliable selection for customers such as contractors
Revenue Growth
Examining a company’s long-term performance can provide clues about its quality. Any business can experience short-term success, but top-performing ones enjoy sustained growth for years. Regrettably, MSC Industrial’s sales grew at a sluggish 3.9% compounded annual growth rate over the last five years. This fell short of our benchmark for the industrials sector and is a tough starting point for our analysis.
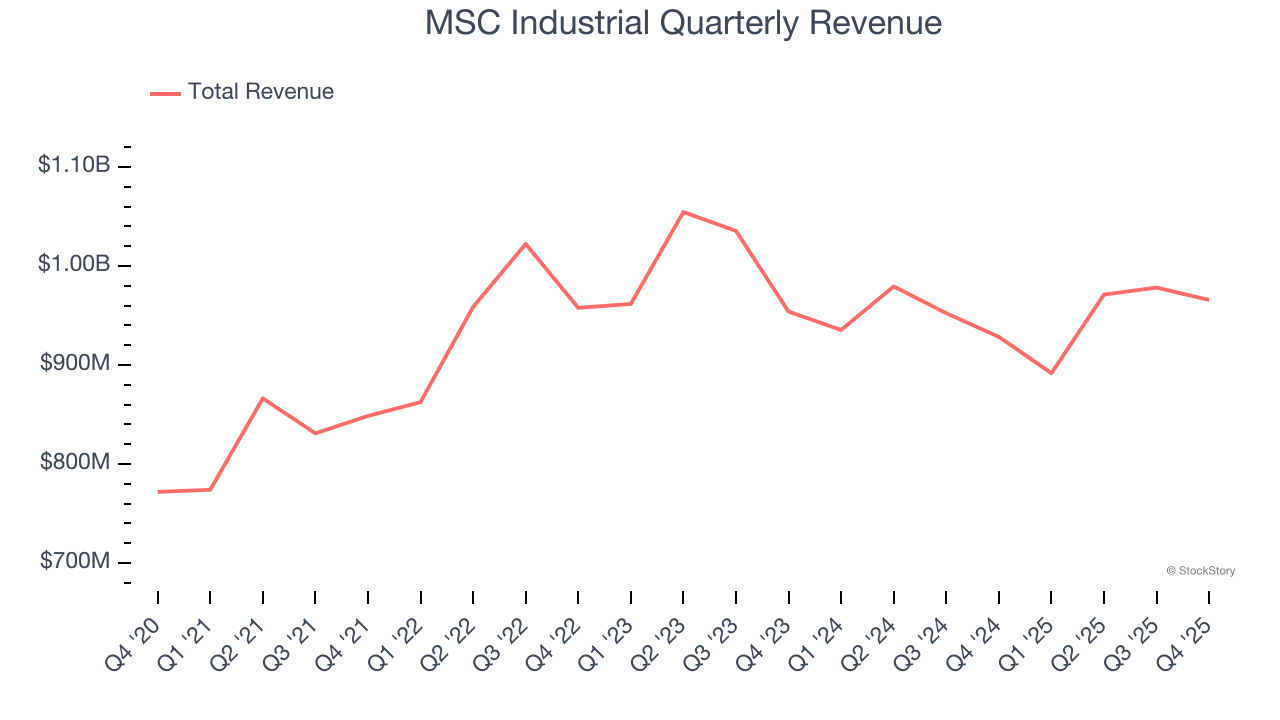
Long-term growth is the most important, but within industrials, a half-decade historical view may miss new industry trends or demand cycles. MSC Industrial’s performance shows it grew in the past but relinquished its gains over the last two years, as its revenue fell by 2.5% annually. 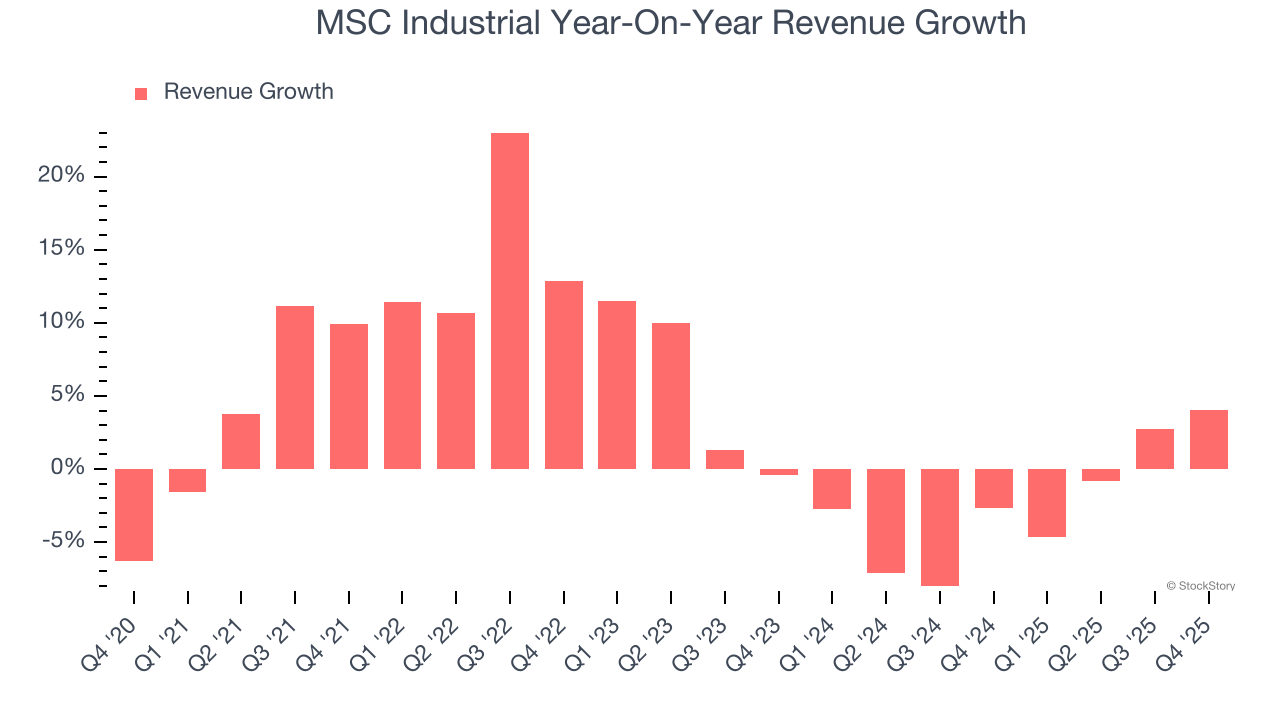
This quarter, MSC Industrial grew its revenue by 4% year on year, and its $965.7 million of revenue was in line with Wall Street’s estimates.
Looking ahead, sell-side analysts expect revenue to grow 5.5% over the next 12 months. While this projection implies its newer products and services will catalyze better top-line performance, it is still below average for the sector.
While Wall Street chases Nvidia at all-time highs, an under-the-radar semiconductor supplier is dominating a critical AI component these giants can’t build without. Click here to access our free report one of our favorites growth stories.
Operating Margin
Operating margin is an important measure of profitability as it shows the portion of revenue left after accounting for all core expenses – everything from the cost of goods sold to advertising and wages. It’s also useful for comparing profitability across companies with different levels of debt and tax rates because it excludes interest and taxes.
MSC Industrial has managed its cost base well over the last five years. It demonstrated solid profitability for an industrials business, producing an average operating margin of 10.5%. This result isn’t surprising as its high gross margin gives it a favorable starting point.
Looking at the trend in its profitability, MSC Industrial’s operating margin decreased by 2.2 percentage points over the last five years. This raises questions about the company’s expense base because its revenue growth should have given it leverage on its fixed costs, resulting in better economies of scale and profitability.
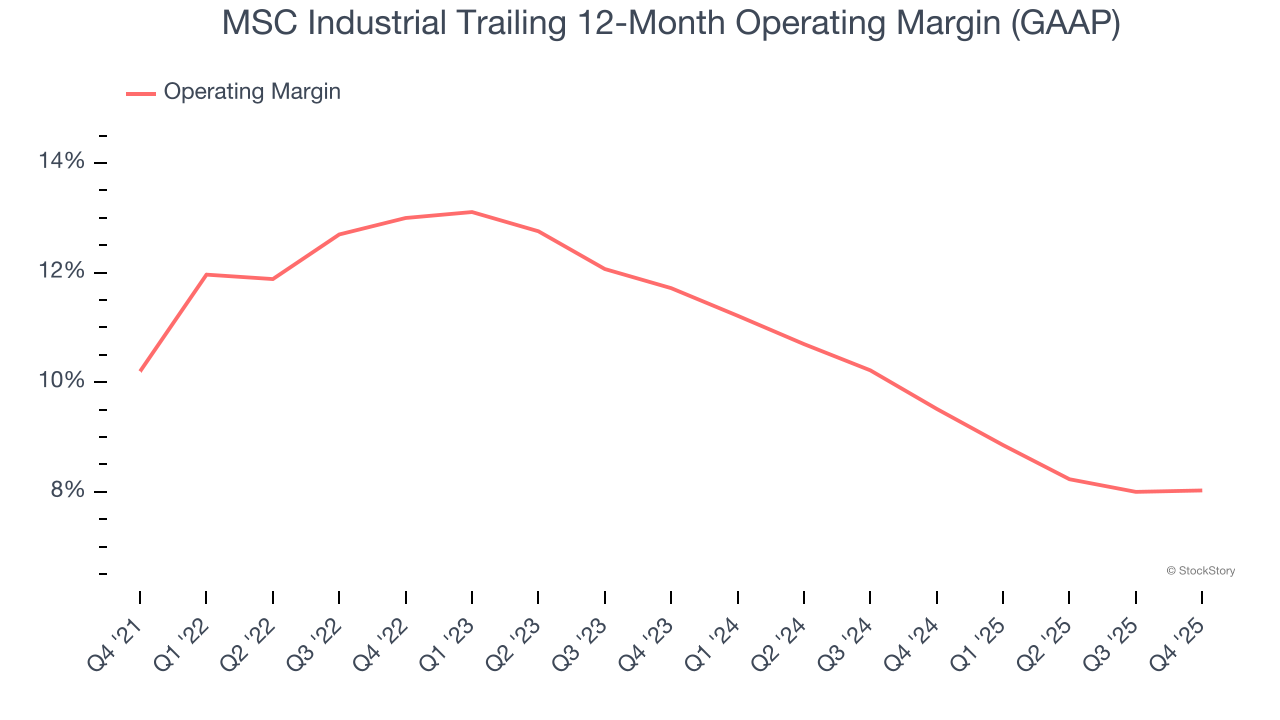
This quarter, MSC Industrial generated an operating margin profit margin of 7.9%, in line with the same quarter last year. This indicates the company’s cost structure has recently been stable.
Earnings Per Share
We track the long-term change in earnings per share (EPS) for the same reason as long-term revenue growth. Compared to revenue, however, EPS highlights whether a company’s growth is profitable.
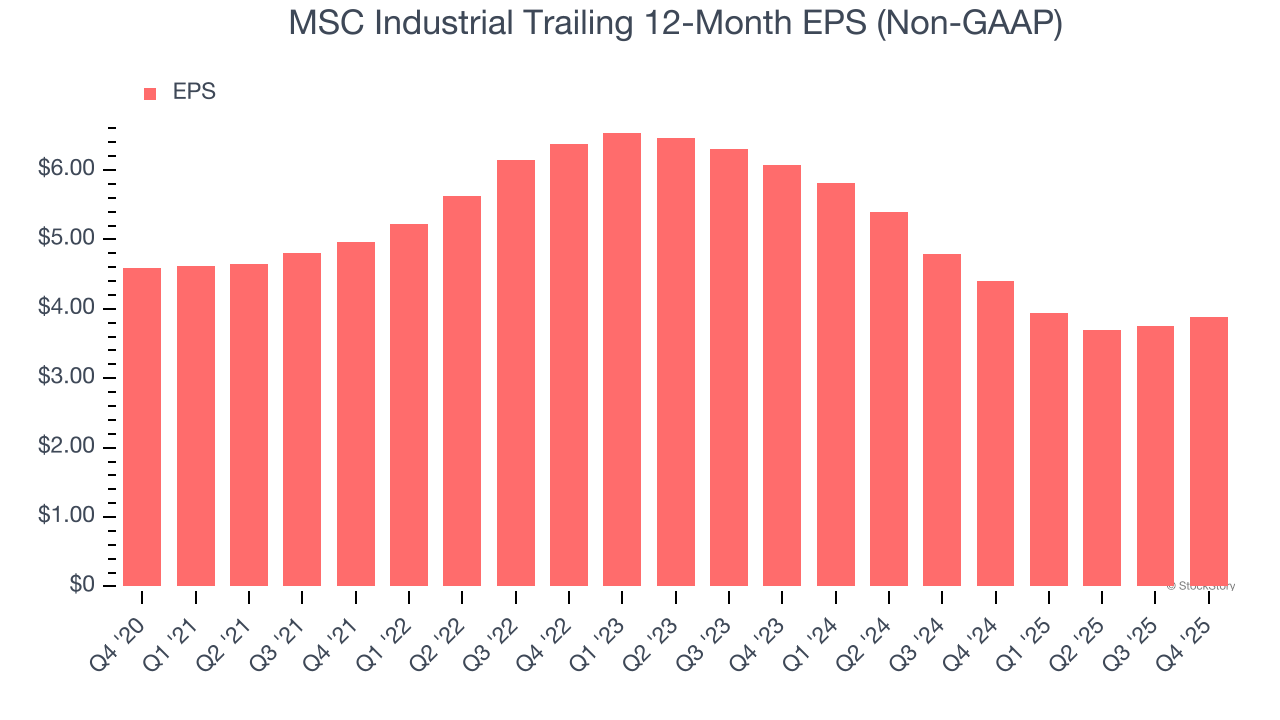
Sadly for MSC Industrial, its EPS declined by 3.3% annually over the last five years while its revenue grew by 3.9%. This tells us the company became less profitable on a per-share basis as it expanded.
Diving into the nuances of MSC Industrial’s earnings can give us a better understanding of its performance. As we mentioned earlier, MSC Industrial’s operating margin was flat this quarter but declined by 2.2 percentage points over the last five years. This was the most relevant factor (aside from the revenue impact) behind its lower earnings; interest expenses and taxes can also affect EPS but don’t tell us as much about a company’s fundamentals.
Like with revenue, we analyze EPS over a more recent period because it can provide insight into an emerging theme or development for the business.
MSC Industrial’s two-year annual EPS declines of 20.1% were bad and lower than its two-year revenue losses.
In Q4, MSC Industrial reported adjusted EPS of $0.99, up from $0.86 in the same quarter last year. This print beat analysts’ estimates by 4.8%. Over the next 12 months, Wall Street expects MSC Industrial’s full-year EPS of $3.88 to grow 13.4%.
Key Takeaways from MSC Industrial’s Q4 Results
It was encouraging to see MSC Industrial beat analysts’ EBITDA expectations this quarter. We were also glad its EPS outperformed Wall Street’s estimates. Overall, this print had some key positives. The stock remained flat at $84.44 immediately after reporting.
So should you invest in MSC Industrial right now? If you’re making that decision, you should consider the bigger picture of valuation, business qualities, as well as the latest earnings. We cover that in our actionable full research report which you can read here, it’s free for active Edge members.