
Masco Corporation (MAS) designs, develops, and markets home improvement and building products globally. The company operates through two broad segments: Plumbing Products and Decorative Architectural Products.
For the third quarter, the company faced a challenging demand environment, which led to a notable decline in its topline. However, the company’s adjusted net income increased by 1% to $1.00 per share, compared to $0.99 per share in the prior year quarter. MAS also raised its fiscal 2023 adjusted EPS expectations from $3.50-$3.65 to $3.65-$3.75.
The company also declared a quarterly dividend of $0.285 per share, payable to shareholders on November 27, 2023. It pays a $1.14 annual dividend, which translates to a 1.93% yield on current prices. Its dividend payouts have increased at a CAGR of 27.9% over the past three years and 21.3% over the past five years.
With such conducive prospects, let’s look at the trends of MAS’ key financial metrics to understand why it could be a solid buy now.
Masco Corporation Financial Performance: Analyzing Metrics and Trends from 2020 to 2023
The following summary outlines the trend and fluctuations in the trailing-12-month net income of MAS over the years:
- MAS recorded a net income of $1.22 billion on December 31, 2020, which showed a declining trend in the next four quarters, with values reaching $788 million on March 31, 2021, $528 million on June 30, 2021, $473 million on September 30, 2021, and hitting a low of $410 million on December 31, 2021.
- However, in the first quarter of 2022, MAS bounced back, registering an increased net income of $549 million on March 31, followed by significant growth to reach $863 million by June 30, 2022.
- The income then slightly dropped to $861 million on September 30, 2022, and further to $844 million at the end of the year on December 31, 2022.
- In 2023, MAS' net income seemed to steady itself, fluctuating marginally between $801 million and $832 million in the first three quarters.
Taking the series as a whole, MAS sees a decline in net income from December 31, 2020, to December 31, 2021, but shows strong recovery and growth from 2022 onwards into the first three quarters of 2023. The more recent data and the last value suggest a steady range of net income for the company in 2023, indicating relative stability to previous years.

Below is a summary of gross margin trends for MAS over a span of about three years. Each value in the series has been multiplied by 100 and is stated as a percentage:
- December 31, 2020: 36% gross margin
- March 31, 2021: 36.2% gross margin
- June 30, 2021: 36.3% gross margin
- September 30, 2021: 35.4% gross margin
- December 31, 2021: 34.2% gross margin
- March 31, 2022: 33.3% gross margin
- June 30, 2022: 32.4% gross margin
- September 30, 2022: 31.7% gross margin
- December 31, 2022: 31.3% gross margin
- March 31, 2023: 31.7% gross margin
- June 30, 2023: 32.5% gross margin
- September 30, 2023: 34.1% gross margin
The trend shows an overall decline in MAS' gross margin from 36% in December 2020 to 34.1% as of September 2023. The highest gross margin was observed at 36.3% in June 2021. On the contrary, the lowest gross margin was reported in December 2022 at 31.3%. After a period of steady decrease, MAS' gross margin began to rebound from March 2023 onwards.
Though there are fluctuations month-to-month, the key observation here is the decline followed by a slight recovery in more recent data.

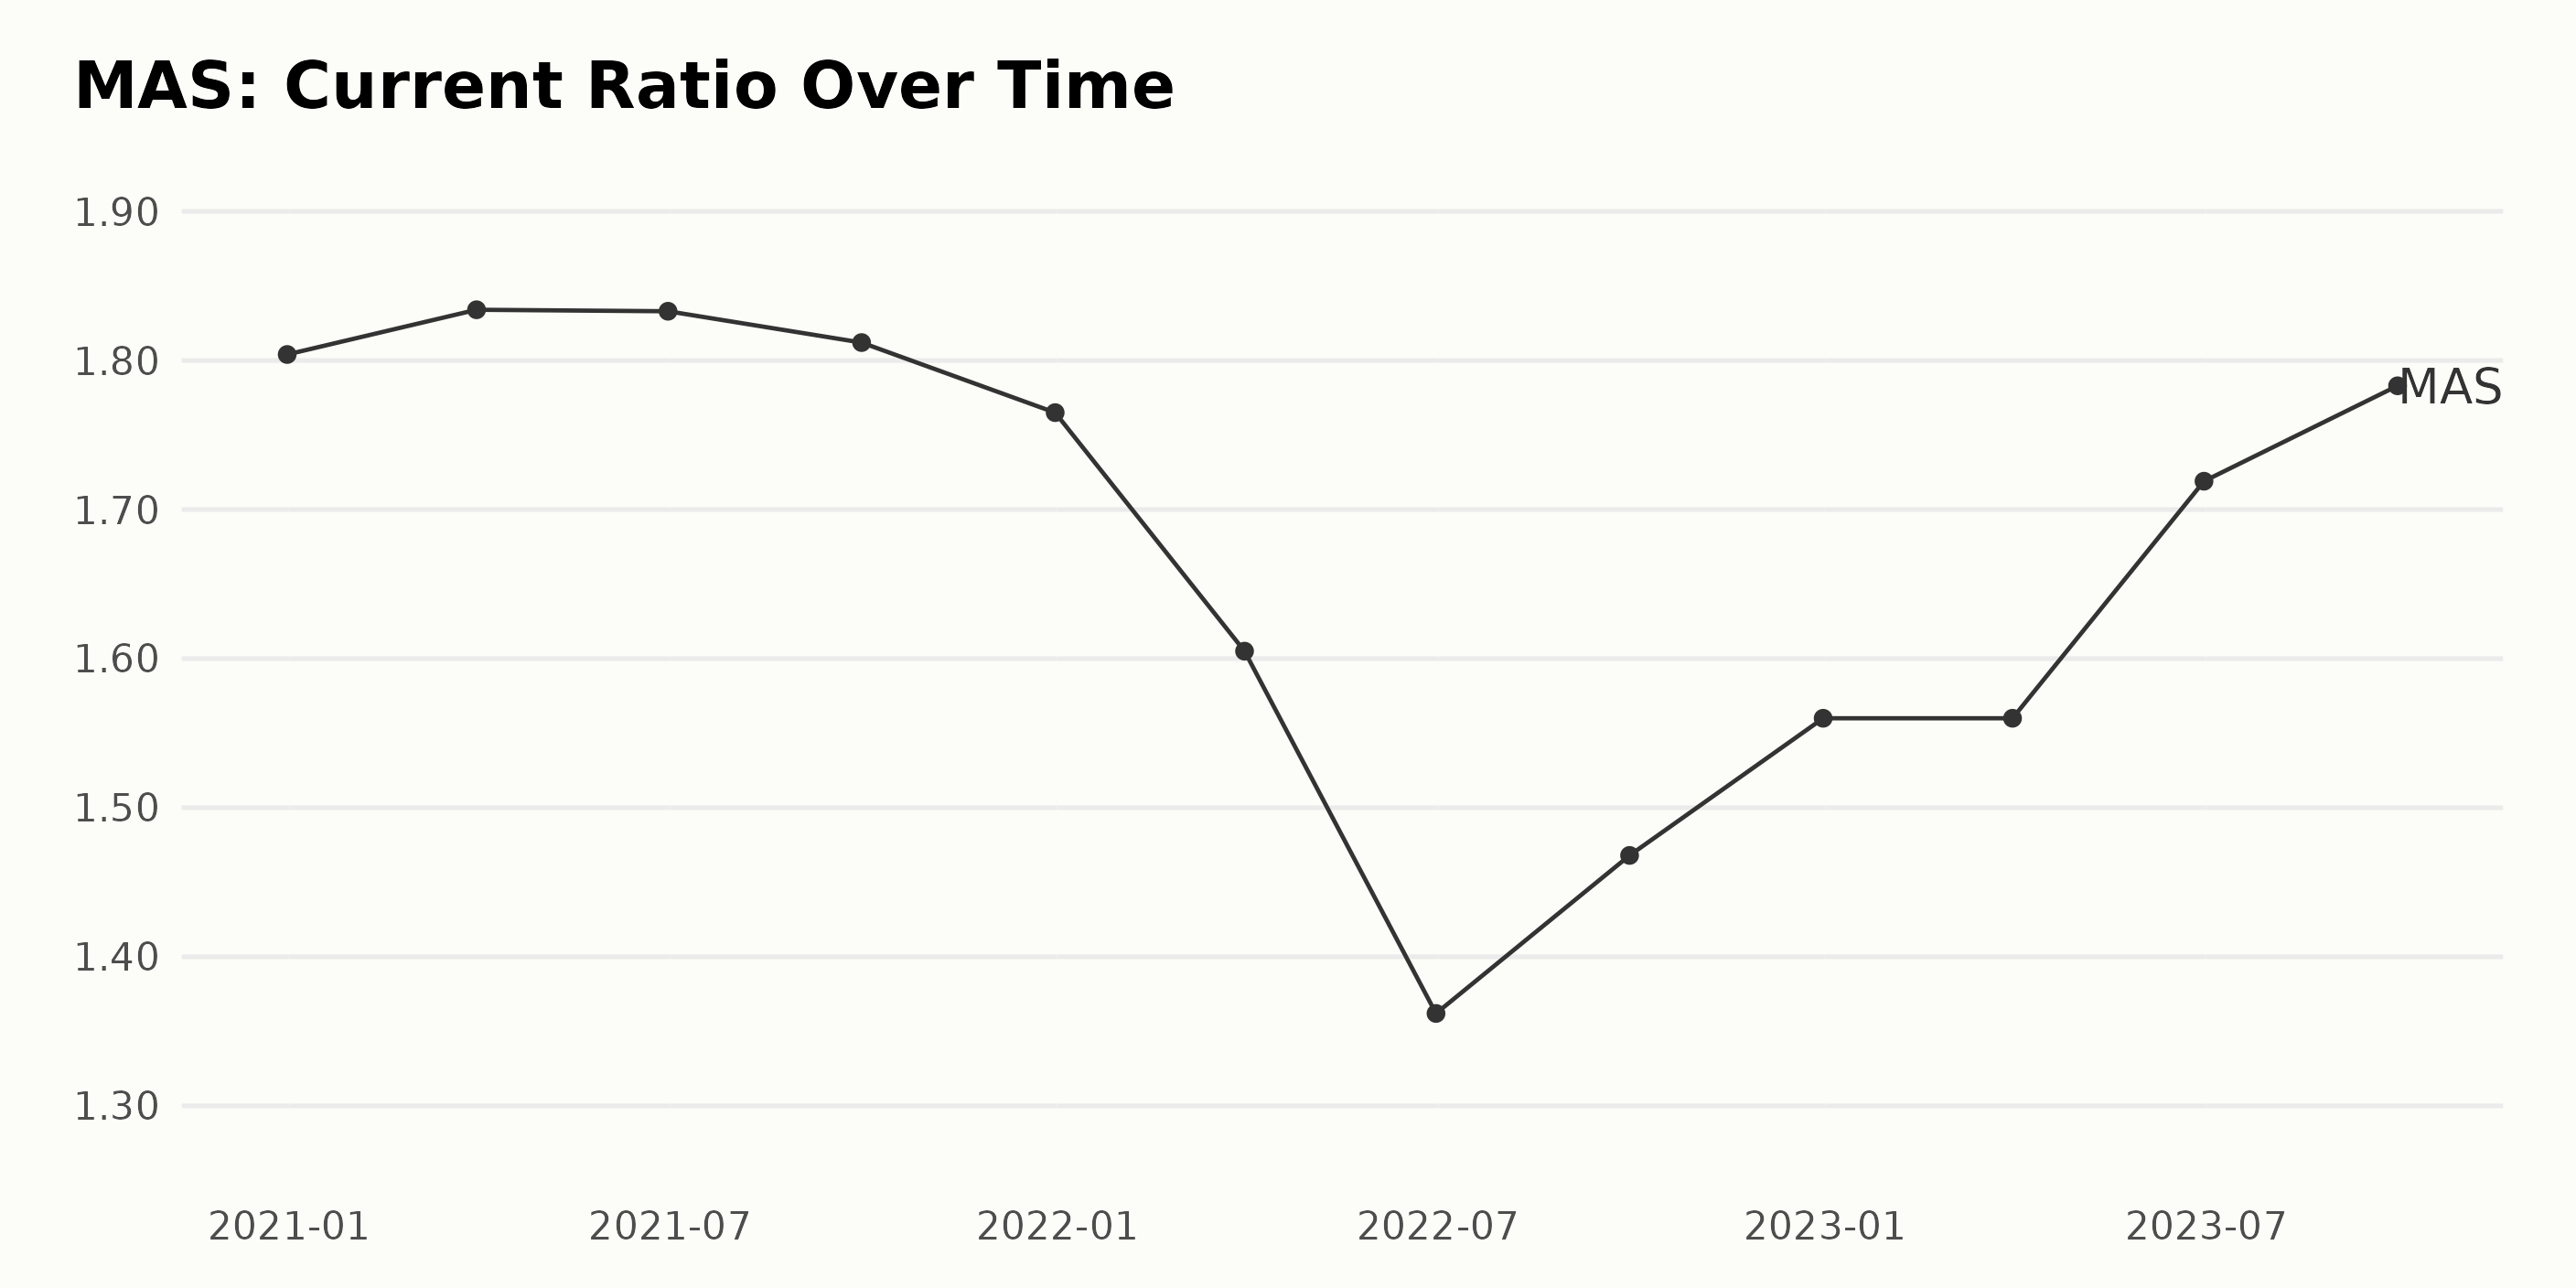
The current ratio of MAS shows noticeable fluctuations and a downward trend within this series of data. Key points can be summarized as follows:
- At the beginning of the series on December 31, 2020, the current ratio was reported at 1.80.
- There was a minor increase in the first half of 2021, peaking at 1.83 in March 2021 and remaining relatively stable throughout June 2021.
- The ratio began falling in the latter half of 2021, going as low as 1.76 by the end of December 2021.
- In 2022, MAS experienced significant volatility. The current ratio fell sharply in the first half of the year to 1.36 by June 2022 but showed recovery by the end of the year, rising to 1.56.
- Into 2023, the current ratio remained stable in the first quarter but then increased over the subsequent two quarters, reaching 1.78 by September 30, 2023.
Despite these fluctuations, the current ratio performance of MAS, while not consistently stable, had managed to remain fairly close to its initial value by the end of the reported series.
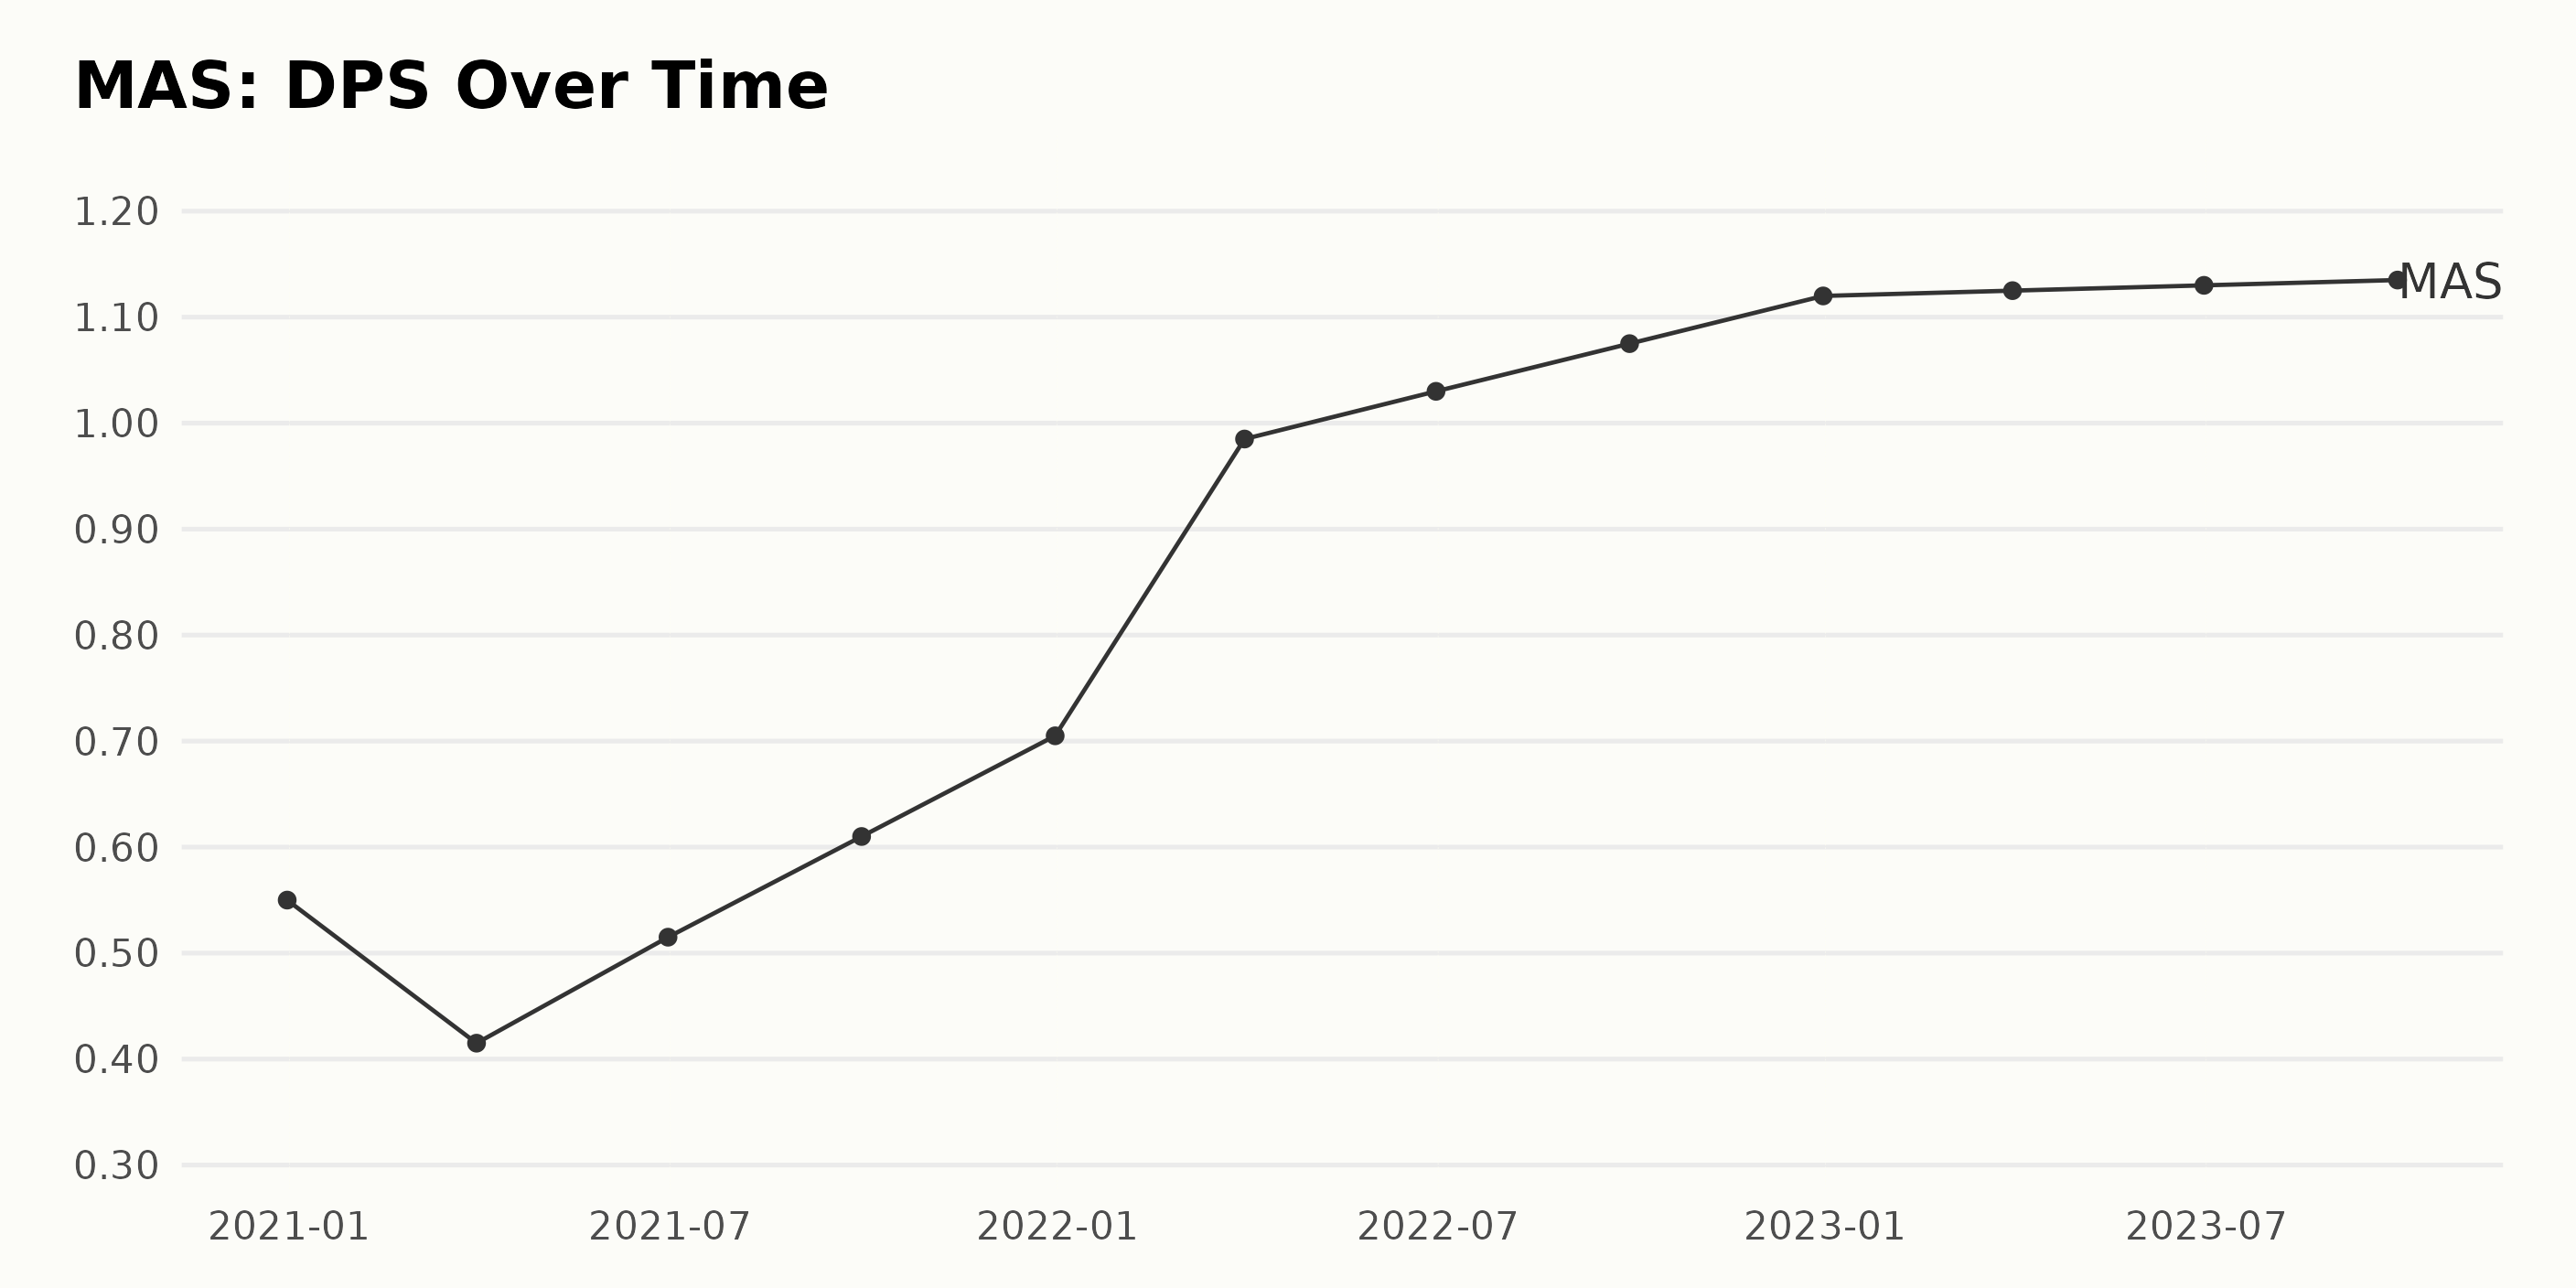
The trend for MAS' Dividend Per Share (DPS) level indicates a steady upward movement from December 2020 to September 2023. Looking at the data:
- In December 2020, the DPS was at $0.55.
- On March 31, 2021, there was a slight dip in the value to $0.415, subsequently it regained momentum and climbed to $0.515 in June 2021.
- By the end of 2021, MAS' DPS surged notably to $0.705, representing an increase of approximately 36% from the start of 2021.
- In 2022, the growth rate continued to be robust, with the DPS peaking at $1.12 by December 2022. This implies an overall increase of 58% from the beginning of the year.
- In 2023, the DPS value saw minor oscillations, starting from $1.125 in March, reaching $1.13 in June, and ending up at $1.14 in September.
Over the overall period from December 2020 to September 2023, MAS depicted impressive growth. Specifically, the DPS grew from $0.55 to $1.14, representing a growth rate of approximately 106%.
The majority of this growth was observed during 2021 and 2022, with a more stable growth rate in 2023. In conclusion, MAS' DPS has shown a consistent uptrend over the years, emphasizing a positive return for stakeholders.
Masco Corporation Share Prices: 2023 Trends and Performance Analysis
The data provided shows the share prices of MAS over several months in 2023. Here is a description of the observed trend:
- In June 2023, the share price increased steadily from $49.61 on June 2 to $56.78 by the end of the month.
- In July, the stock saw continued growth, starting the month at $55.96 and reaching a peak of $61.02 by July 28.
- The first week of August maintained this peak with a slight dip to $60.22, but from mid-August there was a noticeable deceleration in the stock value. The stock dropped to $56.50 by the end of August.
- September saw a further decline with the price starting at $58.49 and ending at $53.48. This downward trend continued into October, when the stock reached a low of $49.91 by October 27.
- However, in November, the trend reversed with an increase to $59.28 by November 22.
In summary, the share price of MAS initially shows a clear upward trend from June to July, then a decelerating trend from mid-August to October, followed by a resurgence in November. Here is a chart of MAS' price over the past 180 days.

Highlighting Masco Corporation's Strong Points: Quality, Sentiment, and Momentum
As of the latest data from November 22, 2023, MAS, a company in the Home Improvement & Goods category of stocks, holds a POWR Ratings grade of B (Buy). This places it on the upper half of the grading scale.
In the recent past, there has been a noteworthy progression in terms of the POWR grade and rank within the category. Critical points to note about the POWR grade and rank of MAS over the course of time are as follows:
- From May 27, 2023, to July 22, 2023, MAS maintained a consistent POWR grade of C (Neutral).
- In terms of rank in the category throughout this period, MAS oscillated between #23 and #27.
- However, a positive shift was observed on July 29, 2023, when the POWR grade for MAS improved to B (Buy).
- Since then, its rank in the category has significantly improved, shifting from the high 20s to, as of November 23, 2023, #15 out of 58 stocks. Although there has been slight fluctuation, the company has consistently ranked better than before.
It is encouraging to witness this positive trend in both the POWR grade and rank in the category for MAS. This indicates a series of improvements or favorable conditions for MAS over the period, enhancing its standings within the Home Improvement & Goods stock category.
The POWR Ratings for MAS across its six dimensions show varying scores. However, three dimensions stood out as having the highest ratings over time: Quality, Sentiment, and Momentum.
Quality: The rating for Quality has consistently been high and has seen a steady increase over the observation period from May to November 2023. Starting with a score of 83 in May 2023, it steadily increased to reach a peak of 90 in November 2023. This suggests a consistent enhancement in the Quality dimension.
Sentiment: The Sentiment rating similarly started at a relatively high point of 75 in May 2023. It showed an upward trend, peaking at 93 in August 2023 and then slightly fluctuating towards the end of the observation period, scoring 74 in November 2023. Notably, Sentiment was at its highest point during August 2023.
Momentum: The Momentum dimension, though not as high as Quality or Sentiment, consistently remained above 50 during the entire observation period, indicating an overall positive momentum for MAS. It peaked at 78 in July 2023 and saw a fall toward the end of the period, scoring 59 in November 2023.
The increasing trend observed in Quality, the generally positive trend seen in Sentiment, and the consistency in Momentum are noteworthy factors for MAS.

How does Masco Corporation (MAS) Stack Up Against its Peers?
Other stocks in the Home Improvement & Goods sector that may be worth considering are Alarm.com Holdings, Inc. (ALRM), Hamilton Beach Brands Holding Company (HBB), and Lifetime Brands, Inc. (LCUT) - they have better POWR Ratings. Click here to explore more Home Improvement & Goods stocks.
What To Do Next?
43 year investment veteran, Steve Reitmeister, has just released his 2024 market outlook along with trading plan and top 11 picks for the year ahead.
MAS shares were trading at $59.28 per share on Thursday morning, up $0.24 (+0.41%). Year-to-date, MAS has gained 29.71%, versus a 20.30% rise in the benchmark S&P 500 index during the same period.
About the Author: Anushka Dutta

Anushka is an analyst whose interest in understanding the impact of broader economic changes on financial markets motivated her to pursue a career in investment research.
The post Why Masco Corporation (MAS) Stands Out as a Prime Building Products Investment appeared first on StockNews.com